
|
EVOTEC SE (EVO) Évaluation DCF |
Entièrement Modifiable: Adapté À Vos Besoins Dans Excel Ou Sheets
Conception Professionnelle: Modèles Fiables Et Conformes Aux Normes Du Secteur
Pré-Construits Pour Une Utilisation Rapide Et Efficace
Compatible MAC/PC, entièrement débloqué
Aucune Expertise N'Est Requise; Facile À Suivre
Evotec SE (EVO) Bundle
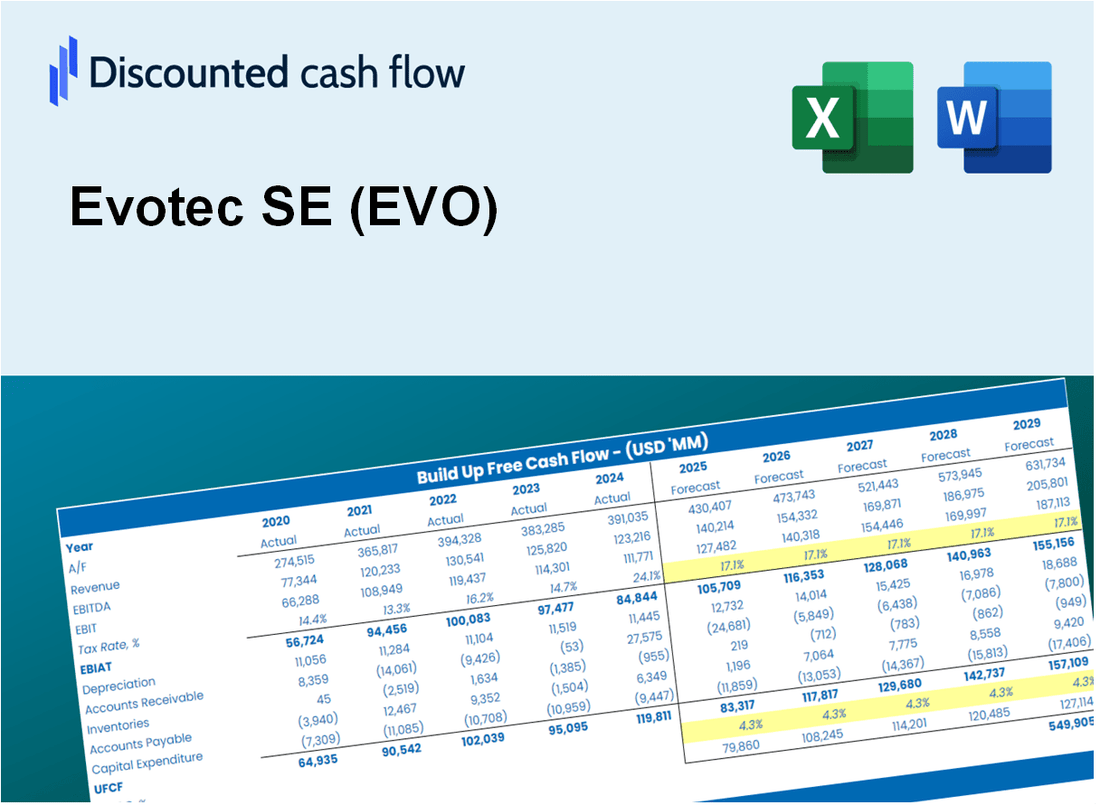
Simplifiez l'évaluation EVOTEC SE (EVO) avec cette calculatrice DCF personnalisable! Doté de véritables entrées financières EVOTEC SE (EVO) et prévisions ajustées, vous pouvez tester les scénarios et découvrir la juste valeur EVOTEC SE (EVO) en minutes.
Discounted Cash Flow (DCF) - (USD MM)
| Year | AY1 2020 |
AY2 2021 |
AY3 2022 |
AY4 2023 |
AY5 2024 |
FY1 2025 |
FY2 2026 |
FY3 2027 |
FY4 2028 |
FY5 2029 |
|---|---|---|---|---|---|---|---|---|---|---|
| Revenue | 580.8 | 716.6 | 871.3 | 906.0 | 924.1 | 1,041.7 | 1,174.4 | 1,324.0 | 1,492.6 | 1,682.7 |
| Revenue Growth, % | 0 | 23.38 | 21.59 | 3.99 | 1.99 | 12.74 | 12.74 | 12.74 | 12.74 | 12.74 |
| EBITDA | 87.5 | 346.0 | -99.8 | 28.0 | -93.5 | 93.5 | 105.4 | 118.8 | 133.9 | 151.0 |
| EBITDA, % | 15.07 | 48.28 | -11.46 | 3.09 | -10.12 | 8.97 | 8.97 | 8.97 | 8.97 | 8.97 |
| Depreciation | 65.0 | 78.4 | 94.7 | 107.8 | 117.8 | 120.1 | 135.4 | 152.6 | 172.1 | 194.0 |
| Depreciation, % | 11.19 | 10.94 | 10.87 | 11.9 | 12.75 | 11.53 | 11.53 | 11.53 | 11.53 | 11.53 |
| EBIT | 22.5 | 267.6 | -194.5 | -79.8 | -211.3 | -26.6 | -30.0 | -33.8 | -38.2 | -43.0 |
| EBIT, % | 3.88 | 37.34 | -22.32 | -8.81 | -22.87 | -2.56 | -2.56 | -2.56 | -2.56 | -2.56 |
| Total Cash | 570.7 | 995.4 | 846.4 | 700.4 | 460.1 | 880.3 | 992.4 | 1,118.8 | 1,261.3 | 1,421.9 |
| Total Cash, percent | .0 | .0 | .0 | .0 | .0 | .0 | .0 | .0 | .0 | .0 |
| Account Receivables | 116.5 | 177.8 | 319.7 | 143.1 | 253.2 | 259.9 | 293.1 | 330.4 | 372.5 | 419.9 |
| Account Receivables, % | 20.06 | 24.81 | 36.7 | 15.79 | 27.4 | 24.95 | 24.95 | 24.95 | 24.95 | 24.95 |
| Inventories | 15.8 | 29.9 | 34.6 | 35.8 | 36.1 | 39.0 | 44.0 | 49.6 | 55.9 | 63.0 |
| Inventories, % | 2.71 | 4.17 | 3.97 | 3.95 | 3.91 | 3.74 | 3.74 | 3.74 | 3.74 | 3.74 |
| Accounts Payable | 49.3 | 84.2 | 112.8 | 155.7 | 99.5 | 127.4 | 143.6 | 161.9 | 182.5 | 205.8 |
| Accounts Payable, % | 8.49 | 11.75 | 12.95 | 17.19 | 10.76 | 12.23 | 12.23 | 12.23 | 12.23 | 12.23 |
| Capital Expenditure | -114.9 | -137.9 | -210.3 | -250.4 | -153.3 | -223.7 | -252.2 | -284.4 | -320.6 | -361.4 |
| Capital Expenditure, % | -19.78 | -19.25 | -24.13 | -27.64 | -16.59 | -21.48 | -21.48 | -21.48 | -21.48 | -21.48 |
| Tax Rate, % | -1.08 | -1.08 | -1.08 | -1.08 | -1.08 | -1.08 | -1.08 | -1.08 | -1.08 | -1.08 |
| EBITAT | 5.5 | 243.4 | -221.9 | -83.1 | -213.6 | -22.1 | -24.9 | -28.1 | -31.7 | -35.7 |
| Depreciation | ||||||||||
| Changes in Account Receivables | ||||||||||
| Changes in Inventories | ||||||||||
| Changes in Accounts Payable | ||||||||||
| Capital Expenditure | ||||||||||
| UFCF | -127.3 | 143.3 | -455.5 | -7.4 | -415.8 | -107.5 | -163.6 | -184.5 | -208.0 | -234.4 |
| WACC, % | 7.62 | 7.99 | 8.04 | 8.04 | 8.04 | 7.95 | 7.95 | 7.95 | 7.95 | 7.95 |
| PV UFCF | ||||||||||
| SUM PV UFCF | -699.7 | |||||||||
| Long Term Growth Rate, % | 2.00 | |||||||||
| Free cash flow (T + 1) | -239 | |||||||||
| Terminal Value | -4,019 | |||||||||
| Present Terminal Value | -2,742 | |||||||||
| Enterprise Value | -3,441 | |||||||||
| Net Debt | 159 | |||||||||
| Equity Value | -3,600 | |||||||||
| Diluted Shares Outstanding, MM | 709 | |||||||||
| Equity Value Per Share | -5.08 |
What You Will Get
- Pre-Filled Financial Model: Evotec SE’s (EVO) actual data facilitates accurate DCF valuation.
- Full Forecast Control: Modify revenue growth, margins, WACC, and other essential drivers.
- Instant Calculations: Automatic updates provide real-time results as you adjust inputs.
- Investor-Ready Template: A polished Excel file crafted for professional-level valuation.
- Customizable and Reusable: Designed for adaptability, enabling repeated use for comprehensive forecasts.
Key Features
- Comprehensive Data: Evotec SE’s historical financial statements and pre-filled projections.
- Customizable Parameters: Adjust WACC, tax rates, revenue growth, and EBITDA margins as needed.
- Real-Time Insights: Watch Evotec SE’s intrinsic value update instantly.
- Intuitive Visualizations: Dashboard graphs illustrate valuation outcomes and essential metrics.
- Designed for Precision: A professional-grade tool for analysts, investors, and finance professionals.
How It Works
- Step 1: Download the Excel file for Evotec SE (EVO).
- Step 2: Review Evotec’s pre-filled financial data and forecasts.
- Step 3: Adjust key inputs such as revenue growth, WACC, and tax rates (highlighted cells).
- Step 4: Observe the DCF model update in real-time as you modify assumptions.
- Step 5: Evaluate the outputs and leverage the results for investment decisions.
Why Choose This Calculator for Evotec SE (EVO)?
- Accurate Data: Up-to-date Evotec financials provide dependable valuation outcomes.
- Customizable: Modify essential parameters such as growth rates, WACC, and tax rates to fit your forecasts.
- Time-Saving: Pre-configured calculations save you from starting from scratch.
- Professional-Grade Tool: Tailored for investors, analysts, and consultants in the biotech sector.
- User-Friendly: Easy-to-navigate design and comprehensive instructions make it accessible for all users.
Who Should Use This Product?
- Investors: Accurately assess Evotec SE’s (EVO) fair value before making investment choices.
- CFOs: Utilize a professional-grade DCF model for financial reporting and analysis related to Evotec SE (EVO).
- Consultants: Efficiently modify the template for valuation reports tailored to Evotec SE (EVO) clients.
- Entrepreneurs: Acquire knowledge of financial modeling techniques employed by leading biotech firms like Evotec SE (EVO).
- Educators: Implement it as a teaching resource to illustrate valuation methodologies relevant to Evotec SE (EVO).
What the Template Contains
- Pre-Filled Data: Includes Evotec SE’s historical financials and forecasts.
- Discounted Cash Flow Model: Editable DCF valuation model with automatic calculations.
- Weighted Average Cost of Capital (WACC): A dedicated sheet for calculating WACC based on custom inputs.
- Key Financial Ratios: Analyze Evotec SE’s profitability, efficiency, and leverage.
- Customizable Inputs: Edit revenue growth, margins, and tax rates with ease.
- Clear Dashboard: Charts and tables summarizing key valuation results.
Disclaimer
All information, articles, and product details provided on this website are for general informational and educational purposes only. We do not claim any ownership over, nor do we intend to infringe upon, any trademarks, copyrights, logos, brand names, or other intellectual property mentioned or depicted on this site. Such intellectual property remains the property of its respective owners, and any references here are made solely for identification or informational purposes, without implying any affiliation, endorsement, or partnership.
We make no representations or warranties, express or implied, regarding the accuracy, completeness, or suitability of any content or products presented. Nothing on this website should be construed as legal, tax, investment, financial, medical, or other professional advice. In addition, no part of this site—including articles or product references—constitutes a solicitation, recommendation, endorsement, advertisement, or offer to buy or sell any securities, franchises, or other financial instruments, particularly in jurisdictions where such activity would be unlawful.
All content is of a general nature and may not address the specific circumstances of any individual or entity. It is not a substitute for professional advice or services. Any actions you take based on the information provided here are strictly at your own risk. You accept full responsibility for any decisions or outcomes arising from your use of this website and agree to release us from any liability in connection with your use of, or reliance upon, the content or products found herein.