
|
Flushing Financial Corporation (FFIC) Évaluation DCF |
Entièrement Modifiable: Adapté À Vos Besoins Dans Excel Ou Sheets
Conception Professionnelle: Modèles Fiables Et Conformes Aux Normes Du Secteur
Pré-Construits Pour Une Utilisation Rapide Et Efficace
Compatible MAC/PC, entièrement débloqué
Aucune Expertise N'Est Requise; Facile À Suivre
Flushing Financial Corporation (FFIC) Bundle
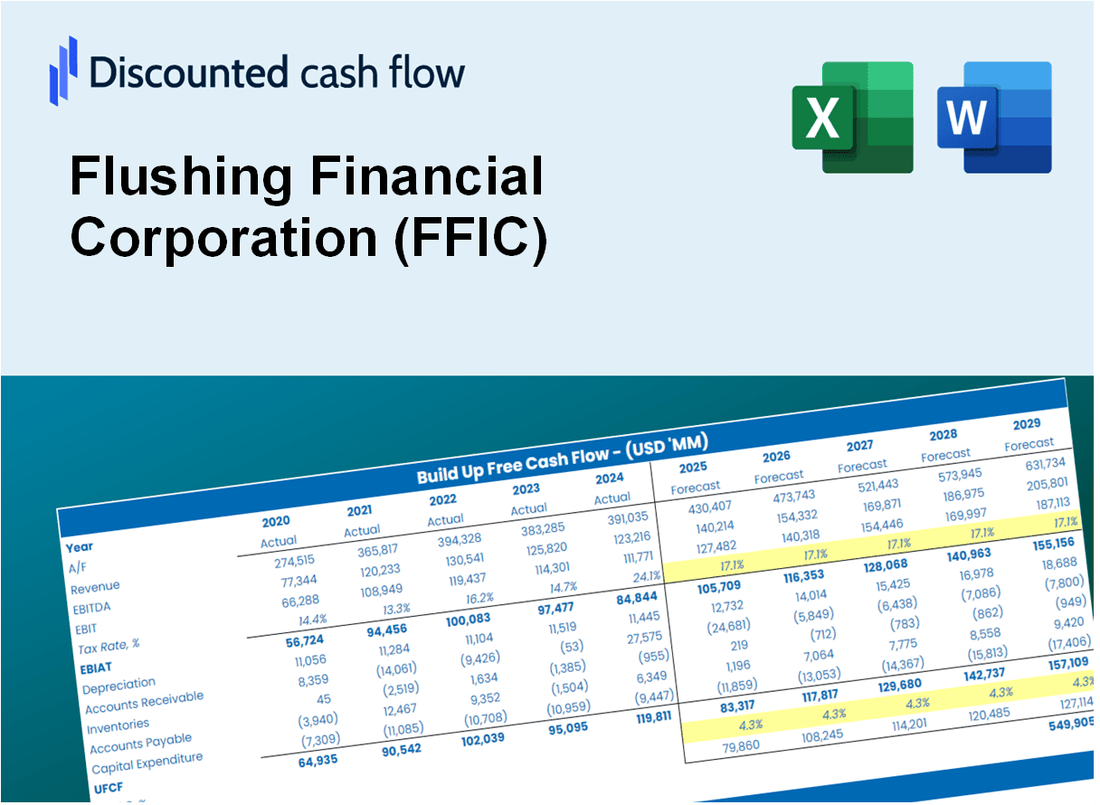
Optimisez votre temps et améliorez la précision avec notre calculatrice (FFIC) DCF! En utilisant des données authentiques de lutte contre les sociétés financières et des hypothèses personnalisables, cet outil vous permet de prévoir, analyser et valoriser (FFIC) comme un investisseur chevronné.
Discounted Cash Flow (DCF) - (USD MM)
| Year | AY1 2020 |
AY2 2021 |
AY3 2022 |
AY4 2023 |
AY5 2024 |
FY1 2025 |
FY2 2026 |
FY3 2027 |
FY4 2028 |
FY5 2029 |
|---|---|---|---|---|---|---|---|---|---|---|
| Revenue | 275.3 | 292.2 | 326.6 | 424.1 | 408.1 | 453.0 | 502.7 | 558.0 | 619.3 | 687.4 |
| Revenue Growth, % | 0 | 6.14 | 11.77 | 29.83 | -3.77 | 10.99 | 10.99 | 10.99 | 10.99 | 10.99 |
| EBITDA | 51.4 | 116.3 | 110.8 | 46.3 | -42.1 | 84.2 | 93.5 | 103.8 | 115.2 | 127.8 |
| EBITDA, % | 18.67 | 39.8 | 33.92 | 10.91 | -10.32 | 18.59 | 18.59 | 18.59 | 18.59 | 18.59 |
| Depreciation | 6.3 | 7.0 | 6.5 | 6.4 | 6.1 | 8.8 | 9.8 | 10.8 | 12.0 | 13.4 |
| Depreciation, % | 2.3 | 2.41 | 1.98 | 1.52 | 1.51 | 1.94 | 1.94 | 1.94 | 1.94 | 1.94 |
| EBIT | 45.1 | 109.3 | 104.3 | 39.8 | -48.3 | 75.4 | 83.7 | 92.9 | 103.1 | 114.5 |
| EBIT, % | 16.37 | 37.39 | 31.93 | 9.39 | -11.83 | 16.65 | 16.65 | 16.65 | 16.65 | 16.65 |
| Total Cash | 805.4 | 859.0 | 648.5 | 803.5 | 1,557.4 | 453.0 | 502.7 | 558.0 | 619.3 | 687.4 |
| Total Cash, percent | .0 | .0 | .0 | .0 | .0 | .0 | .0 | .0 | .0 | .0 |
| Account Receivables | 44.0 | 38.7 | 45.0 | 59.0 | 62.0 | 65.4 | 72.5 | 80.5 | 89.4 | 99.2 |
| Account Receivables, % | 16 | 13.24 | 13.79 | 13.92 | 15.2 | 14.43 | 14.43 | 14.43 | 14.43 | 14.43 |
| Inventories | .0 | .0 | .0 | .0 | .0 | .0 | .0 | .0 | .0 | .0 |
| Inventories, % | 0 | 0 | 0 | 0 | 0 | 0 | 0 | 0 | 0 | 0 |
| Accounts Payable | .0 | .0 | .0 | .0 | .0 | .0 | .0 | .0 | .0 | .0 |
| Accounts Payable, % | 0 | 0 | 0 | 0 | 0 | 0 | 0 | 0 | 0 | 0 |
| Capital Expenditure | -2.5 | -3.7 | -4.3 | -5.5 | -2.3 | -4.9 | -5.4 | -6.0 | -6.6 | -7.4 |
| Capital Expenditure, % | -0.91235 | -1.26 | -1.33 | -1.29 | -0.56605 | -1.07 | -1.07 | -1.07 | -1.07 | -1.07 |
| Tax Rate, % | 35.08 | 35.08 | 35.08 | 35.08 | 35.08 | 35.08 | 35.08 | 35.08 | 35.08 | 35.08 |
| EBITAT | 34.6 | 81.8 | 76.5 | 28.7 | -31.3 | 54.6 | 60.6 | 67.2 | 74.6 | 82.8 |
| Depreciation | ||||||||||
| Changes in Account Receivables | ||||||||||
| Changes in Inventories | ||||||||||
| Changes in Accounts Payable | ||||||||||
| Capital Expenditure | ||||||||||
| UFCF | -5.6 | 90.5 | 72.3 | 15.7 | -30.5 | 55.2 | 57.8 | 64.1 | 71.2 | 79.0 |
| WACC, % | 17.82 | 17.44 | 17.15 | 16.87 | 15.47 | 16.95 | 16.95 | 16.95 | 16.95 | 16.95 |
| PV UFCF | ||||||||||
| SUM PV UFCF | 203.7 | |||||||||
| Long Term Growth Rate, % | 2.00 | |||||||||
| Free cash flow (T + 1) | 81 | |||||||||
| Terminal Value | 539 | |||||||||
| Present Terminal Value | 246 | |||||||||
| Enterprise Value | 450 | |||||||||
| Net Debt | 853 | |||||||||
| Equity Value | -403 | |||||||||
| Diluted Shares Outstanding, MM | 30 | |||||||||
| Equity Value Per Share | -13.46 |
What You Will Get
- Real Flushing Financial Data: Preloaded financials – from revenue to EBIT – based on actual and projected figures for Flushing Financial Corporation (FFIC).
- Full Customization: Adjust all critical parameters (yellow cells) like WACC, growth %, and tax rates specific to Flushing Financial Corporation (FFIC).
- Instant Valuation Updates: Automatic recalculations to analyze the impact of changes on Flushing Financial Corporation’s (FFIC) fair value.
- Versatile Excel Template: Tailored for quick edits, scenario testing, and detailed projections for Flushing Financial Corporation (FFIC).
- Time-Saving and Accurate: Skip building models from scratch while maintaining precision and flexibility for Flushing Financial Corporation (FFIC).
Key Features
- Customizable Financial Inputs: Adjust essential parameters such as loan growth, interest rates, and operating expenses.
- Instant Valuation Metrics: Quickly computes intrinsic value, net present value (NPV), and additional financial outputs.
- High-Precision Estimates: Leverages Flushing Financial Corporation’s (FFIC) actual financial data for accurate valuation results.
- Effortless Scenario Testing: Easily evaluate various financial scenarios and analyze results side by side.
- Efficiency Booster: Streamlines the valuation process, removing the need for intricate model creation.
How It Works
- Step 1: Download the prebuilt Excel template featuring Flushing Financial Corporation’s (FFIC) data.
- Step 2: Navigate through the pre-filled sheets to grasp the essential metrics.
- Step 3: Modify forecasts and assumptions in the editable yellow cells (WACC, growth, margins).
- Step 4: Instantly observe recalculated results, including Flushing Financial Corporation’s (FFIC) intrinsic value.
- Step 5: Make informed investment decisions or create reports using the generated outputs.
Why Choose This Calculator for Flushing Financial Corporation (FFIC)?
- Accurate Data: Up-to-date Flushing Financial Corporation financials provide dependable valuation outcomes.
- Customizable: Tailor essential parameters such as growth rates, WACC, and tax rates to align with your forecasts.
- Time-Saving: Built-in calculations save you the hassle of starting from the ground up.
- Professional-Grade Tool: Crafted for investors, analysts, and consultants in the financial sector.
- User-Friendly: Simple design and clear instructions make it accessible for users of all levels.
Who Should Use This Product?
- Investors: Accurately assess Flushing Financial Corporation’s (FFIC) fair value prior to making investment choices.
- CFOs: Utilize a professional-grade DCF model for financial analysis and reporting at Flushing Financial Corporation (FFIC).
- Consultants: Efficiently customize the template for valuation reports tailored to clients involving Flushing Financial Corporation (FFIC).
- Entrepreneurs: Acquire knowledge of financial modeling practices employed by leading financial institutions like Flushing Financial Corporation (FFIC).
- Educators: Implement it as a teaching resource to illustrate valuation techniques relevant to Flushing Financial Corporation (FFIC).
What the Template Contains
- Historical Data: Includes Flushing Financial Corporation’s (FFIC) past financials and baseline forecasts.
- DCF and Levered DCF Models: Detailed templates to calculate Flushing Financial Corporation’s (FFIC) intrinsic value.
- WACC Sheet: Pre-built calculations for Weighted Average Cost of Capital specific to Flushing Financial Corporation (FFIC).
- Editable Inputs: Modify key drivers like growth rates, EBITDA %, and CAPEX assumptions tailored for Flushing Financial Corporation (FFIC).
- Quarterly and Annual Statements: A complete breakdown of Flushing Financial Corporation’s (FFIC) financials.
- Interactive Dashboard: Visualize valuation results and projections for Flushing Financial Corporation (FFIC) dynamically.
Disclaimer
All information, articles, and product details provided on this website are for general informational and educational purposes only. We do not claim any ownership over, nor do we intend to infringe upon, any trademarks, copyrights, logos, brand names, or other intellectual property mentioned or depicted on this site. Such intellectual property remains the property of its respective owners, and any references here are made solely for identification or informational purposes, without implying any affiliation, endorsement, or partnership.
We make no representations or warranties, express or implied, regarding the accuracy, completeness, or suitability of any content or products presented. Nothing on this website should be construed as legal, tax, investment, financial, medical, or other professional advice. In addition, no part of this site—including articles or product references—constitutes a solicitation, recommendation, endorsement, advertisement, or offer to buy or sell any securities, franchises, or other financial instruments, particularly in jurisdictions where such activity would be unlawful.
All content is of a general nature and may not address the specific circumstances of any individual or entity. It is not a substitute for professional advice or services. Any actions you take based on the information provided here are strictly at your own risk. You accept full responsibility for any decisions or outcomes arising from your use of this website and agree to release us from any liability in connection with your use of, or reliance upon, the content or products found herein.