
|
Eiffage SA (FGR.PA) Évaluation DCF |
Entièrement Modifiable: Adapté À Vos Besoins Dans Excel Ou Sheets
Conception Professionnelle: Modèles Fiables Et Conformes Aux Normes Du Secteur
Pré-Construits Pour Une Utilisation Rapide Et Efficace
Compatible MAC/PC, entièrement débloqué
Aucune Expertise N'Est Requise; Facile À Suivre
Eiffage SA (FGR.PA) Bundle
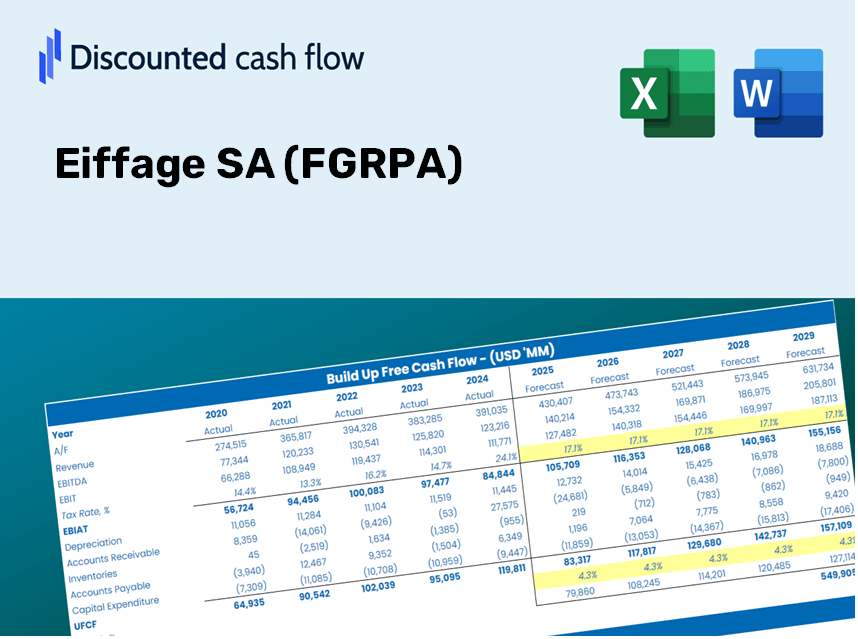
Gardez un aperçu de votre analyse d'évaluation Eiffage SA (FGRPA) en utilisant notre calculatrice sophistiquée DCF! Préchargé avec des données réelles (FGRPA), ce modèle Excel vous permet d'ajuster les prévisions et les hypothèses pour un calcul précis de la valeur intrinsèque d'Eiffage SA.
What You Will Receive
- Accurate FGRPA Financial Data: Features both historical and projected figures for precise valuation.
- Customizable Inputs: Adjust WACC, tax rates, revenue growth, and capital expenditures as needed.
- Dynamic Calculations: Intrinsic value and NPV are calculated automatically in real time.
- Scenario Analysis: Explore various scenarios to assess Eiffage SA's future prospects.
- Clear and User-Friendly Interface: Designed for professionals while remaining accessible to newcomers.
Key Features
- Comprehensive Historical Data: Access Eiffage SA's (FGRPA) past financial performance and pre-set forecasts.
- Customizable Parameters: Modify WACC, tax rates, revenue growth, and EBITDA margins to fit your analysis.
- Real-Time Results: Observe Eiffage SA's (FGRPA) intrinsic value recalculating instantly.
- Intuitive Visual Outputs: Dashboard graphs present valuation results and essential metrics clearly.
- Designed for Precision: A specialized tool tailored for analysts, investors, and finance professionals.
How It Works
- Step 1: Download the prebuilt Excel template that contains Eiffage SA’s (FGRPA) data.
- Step 2: Navigate through the pre-filled sheets to familiarize yourself with the essential metrics.
- Step 3: Modify forecasts and assumptions in the editable yellow cells (WACC, growth, margins).
- Step 4: Instantly see the updated results, which include the intrinsic value of Eiffage SA (FGRPA).
- Step 5: Use the outputs to make well-informed investment decisions or create reports.
Why Opt for This Calculator?
- Designed for Experts: A sophisticated tool tailored for analysts, CFOs, and consultants.
- Accurate Data: Eiffage SA's historical and projected financials preloaded for precision.
- Flexible Scenario Analysis: Effortlessly simulate various forecasts and assumptions.
- Comprehensive Outputs: Automatically calculates intrinsic value, NPV, and essential metrics.
- User-Friendly: Clear, step-by-step instructions lead you through the entire process.
Who Can Benefit from Eiffage SA (FGRPA)?
- Investors: Enhance your investment strategies with a reliable valuation tool from Eiffage SA (FGRPA).
- Financial Analysts: Streamline your analysis process with a customizable DCF model provided by Eiffage SA (FGRPA).
- Consultants: Efficiently modify the template for client reports or presentations related to Eiffage SA (FGRPA).
- Finance Enthusiasts: Expand your knowledge of valuation practices using examples from Eiffage SA (FGRPA).
- Educators and Students: Incorporate it as a practical resource in finance courses focused on Eiffage SA (FGRPA).
Contents of the Template
- Operating and Balance Sheet Data: Pre-filled historical data and forecasts for Eiffage SA (FGRPA), including revenue, EBITDA, EBIT, and capital expenditures.
- WACC Calculation: A dedicated sheet for calculating the Weighted Average Cost of Capital (WACC), featuring parameters such as Beta, risk-free rate, and share price.
- DCF Valuation (Unlevered and Levered): Customizable Discounted Cash Flow models that display intrinsic value with comprehensive calculations.
- Financial Statements: Pre-loaded annual and quarterly financial statements for Eiffage SA (FGRPA) to facilitate analysis.
- Key Ratios: A collection of profitability, leverage, and efficiency ratios pertaining to Eiffage SA (FGRPA).
- Dashboard and Charts: A visual overview of valuation outputs and assumptions to streamline result analysis.
Disclaimer
All information, articles, and product details provided on this website are for general informational and educational purposes only. We do not claim any ownership over, nor do we intend to infringe upon, any trademarks, copyrights, logos, brand names, or other intellectual property mentioned or depicted on this site. Such intellectual property remains the property of its respective owners, and any references here are made solely for identification or informational purposes, without implying any affiliation, endorsement, or partnership.
We make no representations or warranties, express or implied, regarding the accuracy, completeness, or suitability of any content or products presented. Nothing on this website should be construed as legal, tax, investment, financial, medical, or other professional advice. In addition, no part of this site—including articles or product references—constitutes a solicitation, recommendation, endorsement, advertisement, or offer to buy or sell any securities, franchises, or other financial instruments, particularly in jurisdictions where such activity would be unlawful.
All content is of a general nature and may not address the specific circumstances of any individual or entity. It is not a substitute for professional advice or services. Any actions you take based on the information provided here are strictly at your own risk. You accept full responsibility for any decisions or outcomes arising from your use of this website and agree to release us from any liability in connection with your use of, or reliance upon, the content or products found herein.