
|
Five9, Inc. (FIVN) Évaluation DCF |
Entièrement Modifiable: Adapté À Vos Besoins Dans Excel Ou Sheets
Conception Professionnelle: Modèles Fiables Et Conformes Aux Normes Du Secteur
Pré-Construits Pour Une Utilisation Rapide Et Efficace
Compatible MAC/PC, entièrement débloqué
Aucune Expertise N'Est Requise; Facile À Suivre
Five9, Inc. (FIVN) Bundle
Optimisez votre efficacité et améliorez la précision avec notre calculatrice DCF Five9, Inc. (FIVN)! Avec des données en direct de Five9 et des hypothèses personnalisables, cet outil vous permet de prévoir, d'analyser et de évaluer Five9, Inc. (FIVN) tout comme un investisseur chevronné.
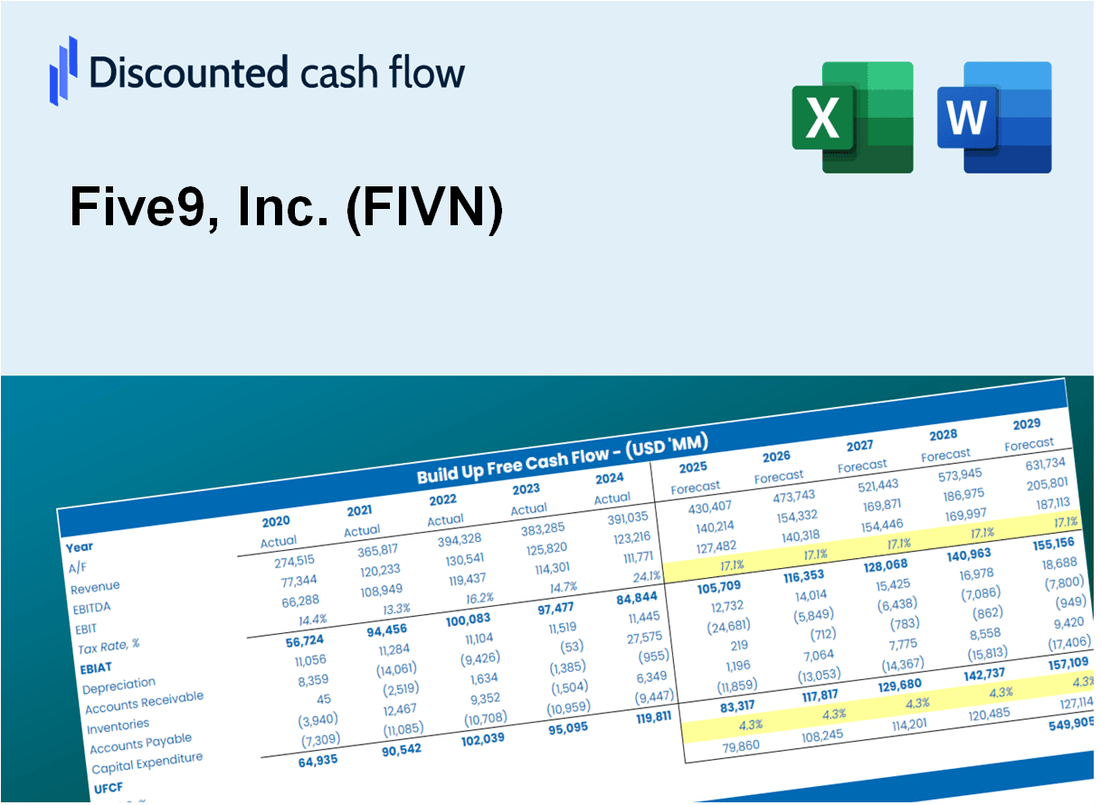
Discounted Cash Flow (DCF) - (USD MM)
| Year | AY1 2020 |
AY2 2021 |
AY3 2022 |
AY4 2023 |
AY5 2024 |
FY1 2025 |
FY2 2026 |
FY3 2027 |
FY4 2028 |
FY5 2029 |
|---|---|---|---|---|---|---|---|---|---|---|
| Revenue | 434.9 | 609.6 | 778.8 | 910.5 | 1,041.9 | 1,300.5 | 1,623.3 | 2,026.1 | 2,529.0 | 3,156.6 |
| Revenue Growth, % | 0 | 40.17 | 27.77 | 16.9 | 14.44 | 24.82 | 24.82 | 24.82 | 24.82 | 24.82 |
| EBITDA | 14.5 | -8.8 | -38.1 | -23.3 | 55.0 | -.7 | -.9 | -1.1 | -1.4 | -1.7 |
| EBITDA, % | 3.34 | -1.45 | -4.89 | -2.55 | 5.27 | -0.05507551 | -0.05507551 | -0.05507551 | -0.05507551 | -0.05507551 |
| Depreciation | 30.8 | 47.4 | 44.7 | 48.5 | 52.9 | 80.6 | 100.6 | 125.6 | 156.8 | 195.7 |
| Depreciation, % | 7.08 | 7.78 | 5.74 | 5.33 | 5.08 | 6.2 | 6.2 | 6.2 | 6.2 | 6.2 |
| EBIT | -16.2 | -56.3 | -82.8 | -71.8 | 2.1 | -81.3 | -101.5 | -126.7 | -158.2 | -197.4 |
| EBIT, % | -3.73 | -9.23 | -10.63 | -7.88 | 0.19742 | -6.25 | -6.25 | -6.25 | -6.25 | -6.25 |
| Total Cash | 603.5 | 469.9 | 614.3 | 730.3 | 1,006.0 | 1,125.5 | 1,404.8 | 1,753.4 | 2,188.6 | 2,731.7 |
| Total Cash, percent | .0 | .0 | .0 | .0 | .0 | .0 | .0 | .0 | .0 | .0 |
| Account Receivables | 50.0 | 86.3 | 90.9 | 101.5 | 122.4 | 156.7 | 195.5 | 244.1 | 304.6 | 380.3 |
| Account Receivables, % | 11.5 | 14.16 | 11.67 | 11.15 | 11.75 | 12.05 | 12.05 | 12.05 | 12.05 | 12.05 |
| Inventories | .0 | .0 | .0 | .0 | .0 | .0 | .0 | .0 | .0 | .0 |
| Inventories, % | 0 | 0 | 0 | 0 | 0 | 0 | 0 | 0 | 0 | 0 |
| Accounts Payable | 17.1 | 20.5 | 23.6 | 24.4 | 26.3 | 40.4 | 50.5 | 63.0 | 78.6 | 98.1 |
| Accounts Payable, % | 3.94 | 3.36 | 3.03 | 2.68 | 2.52 | 3.11 | 3.11 | 3.11 | 3.11 | 3.11 |
| Capital Expenditure | -30.4 | -42.2 | -56.2 | -31.2 | -64.6 | -80.0 | -99.9 | -124.7 | -155.6 | -194.2 |
| Capital Expenditure, % | -7 | -6.93 | -7.21 | -3.43 | -6.2 | -6.15 | -6.15 | -6.15 | -6.15 | -6.15 |
| Tax Rate, % | -0.3136 | -0.3136 | -0.3136 | -0.3136 | -0.3136 | -0.3136 | -0.3136 | -0.3136 | -0.3136 | -0.3136 |
| EBITAT | -15.3 | -46.4 | -86.8 | -73.9 | 2.1 | -77.6 | -96.8 | -120.9 | -150.9 | -188.3 |
| Depreciation | ||||||||||
| Changes in Account Receivables | ||||||||||
| Changes in Inventories | ||||||||||
| Changes in Accounts Payable | ||||||||||
| Capital Expenditure | ||||||||||
| UFCF | -47.9 | -74.1 | -99.7 | -66.5 | -28.6 | -97.1 | -124.9 | -155.9 | -194.6 | -242.9 |
| WACC, % | 7.14 | 6.93 | 7.23 | 7.23 | 7.23 | 7.15 | 7.15 | 7.15 | 7.15 | 7.15 |
| PV UFCF | ||||||||||
| SUM PV UFCF | -645.9 | |||||||||
| Long Term Growth Rate, % | 2.00 | |||||||||
| Free cash flow (T + 1) | -248 | |||||||||
| Terminal Value | -4,810 | |||||||||
| Present Terminal Value | -3,405 | |||||||||
| Enterprise Value | -4,051 | |||||||||
| Net Debt | 871 | |||||||||
| Equity Value | -4,922 | |||||||||
| Diluted Shares Outstanding, MM | 75 | |||||||||
| Equity Value Per Share | -66.06 |
What You Will Get
- Real FIVN Financial Data: Pre-filled with Five9’s historical and projected data for precise analysis.
- Fully Editable Template: Modify key inputs like revenue growth, WACC, and EBITDA % with ease.
- Automatic Calculations: See Five9’s intrinsic value update instantly based on your changes.
- Professional Valuation Tool: Designed for investors, analysts, and consultants seeking accurate DCF results.
- User-Friendly Design: Simple structure and clear instructions for all experience levels.
Key Features
- Customizable Forecast Inputs: Adjust essential factors such as customer growth, revenue projections, and operational costs.
- Instant DCF Valuation: Quickly computes intrinsic value, NPV, and various financial metrics.
- High-Precision Accuracy: Leverages Five9’s actual financial data for credible valuation results.
- Effortless Scenario Analysis: Evaluate multiple assumptions and analyze results effortlessly.
- Efficiency Booster: Streamline the valuation process without having to create intricate models from the ground up.
How It Works
- Download: Get the pre-built Excel file featuring Five9, Inc.'s (FIVN) financial data.
- Customize: Modify projections, such as revenue growth, EBITDA %, and WACC.
- Update Automatically: The intrinsic value and NPV calculations refresh in real-time.
- Test Scenarios: Develop various projections and instantly compare results.
- Make Decisions: Leverage the valuation findings to inform your investment strategy.
Why Choose This Calculator for Five9, Inc. (FIVN)?
- Accurate Data: Utilize real Five9 financials for dependable valuation outcomes.
- Customizable: Tailor essential metrics such as growth rates, WACC, and tax rates to fit your forecasts.
- Time-Saving: Ready-made calculations remove the hassle of starting from scratch.
- Professional-Grade Tool: Crafted for investors, analysts, and consultants in the industry.
- User-Friendly: Easy-to-navigate design and clear instructions ensure accessibility for all users.
Who Should Use This Product?
- Individual Investors: Make informed decisions about buying or selling Five9, Inc. (FIVN) stock.
- Financial Analysts: Streamline valuation processes with ready-to-use financial models for Five9, Inc. (FIVN).
- Consultants: Deliver professional valuation insights on Five9, Inc. (FIVN) to clients quickly and accurately.
- Business Owners: Understand how cloud contact center solutions like those from Five9, Inc. (FIVN) are valued to guide your own strategy.
- Finance Students: Learn valuation techniques using real-world data and scenarios related to Five9, Inc. (FIVN).
What the Template Contains
- Operating and Balance Sheet Data: Pre-filled Five9 historical data and forecasts, including revenue, EBITDA, EBIT, and capital expenditures.
- WACC Calculation: A dedicated sheet for Weighted Average Cost of Capital (WACC), including parameters like Beta, risk-free rate, and share price.
- DCF Valuation (Unlevered and Levered): Editable Discounted Cash Flow models showing intrinsic value with detailed calculations.
- Financial Statements: Pre-loaded financial statements (annual and quarterly) to support analysis.
- Key Ratios: Includes profitability, leverage, and efficiency ratios for Five9, Inc. (FIVN).
- Dashboard and Charts: Visual summary of valuation outputs and assumptions to analyze results easily.
Disclaimer
All information, articles, and product details provided on this website are for general informational and educational purposes only. We do not claim any ownership over, nor do we intend to infringe upon, any trademarks, copyrights, logos, brand names, or other intellectual property mentioned or depicted on this site. Such intellectual property remains the property of its respective owners, and any references here are made solely for identification or informational purposes, without implying any affiliation, endorsement, or partnership.
We make no representations or warranties, express or implied, regarding the accuracy, completeness, or suitability of any content or products presented. Nothing on this website should be construed as legal, tax, investment, financial, medical, or other professional advice. In addition, no part of this site—including articles or product references—constitutes a solicitation, recommendation, endorsement, advertisement, or offer to buy or sell any securities, franchises, or other financial instruments, particularly in jurisdictions where such activity would be unlawful.
All content is of a general nature and may not address the specific circumstances of any individual or entity. It is not a substitute for professional advice or services. Any actions you take based on the information provided here are strictly at your own risk. You accept full responsibility for any decisions or outcomes arising from your use of this website and agree to release us from any liability in connection with your use of, or reliance upon, the content or products found herein.