
|
Franklin Wireless Corp. (FKWL) Évaluation DCF |
Entièrement Modifiable: Adapté À Vos Besoins Dans Excel Ou Sheets
Conception Professionnelle: Modèles Fiables Et Conformes Aux Normes Du Secteur
Pré-Construits Pour Une Utilisation Rapide Et Efficace
Compatible MAC/PC, entièrement débloqué
Aucune Expertise N'Est Requise; Facile À Suivre
Franklin Wireless Corp. (FKWL) Bundle
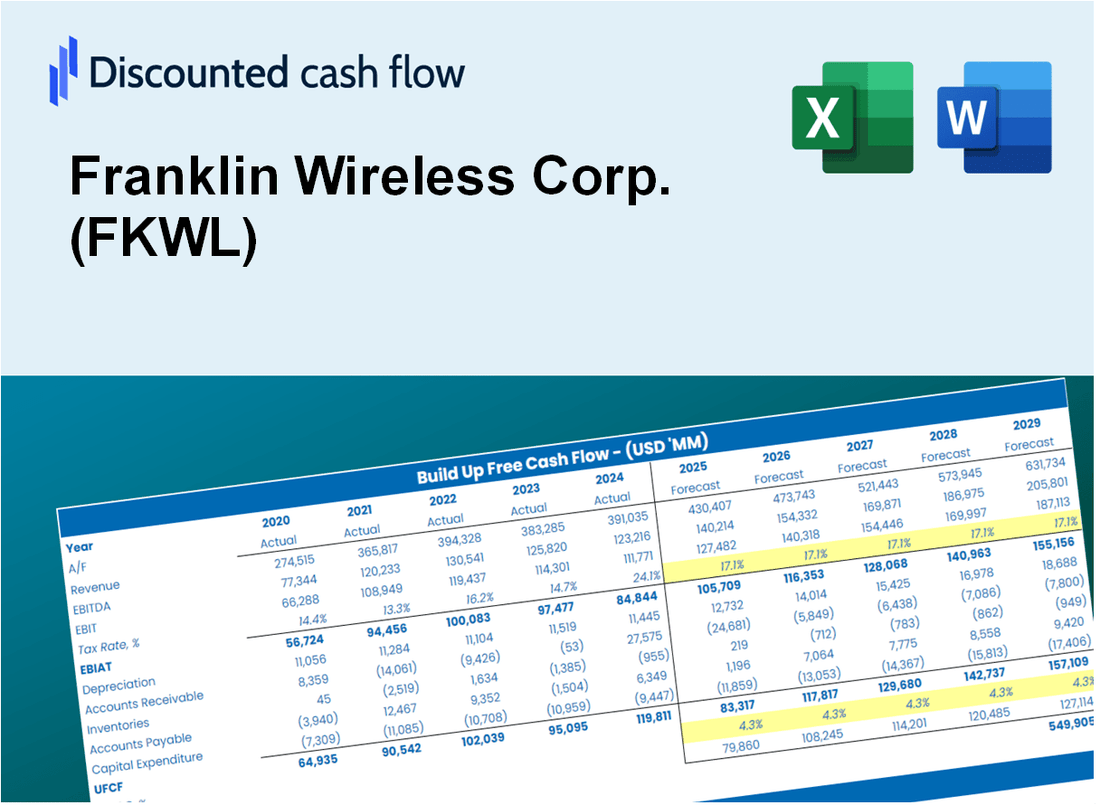
Gardez un aperçu de votre analyse d'évaluation de votre Franklin Wireless Corp. (FKWL) à l'aide de notre calculatrice sophistiquée DCF! Préchargé avec des données FKWL réelles, ce modèle Excel vous permet d'ajuster les prévisions et les hypothèses pour déterminer avec précision la valeur intrinsèque de Franklin Wireless Corp. (FKWL).
Discounted Cash Flow (DCF) - (USD MM)
| Year | AY1 2021 |
AY2 2022 |
AY3 2023 |
AY4 2024 |
AY5 2025 |
FY1 2026 |
FY2 2027 |
FY3 2028 |
FY4 2029 |
FY5 2030 |
|---|---|---|---|---|---|---|---|---|---|---|
| Revenue | 184.1 | 24.0 | 45.9 | 30.8 | 46.1 | 57.4 | 71.4 | 88.9 | 110.7 | 137.8 |
| Revenue Growth, % | 0 | -86.97 | 91.47 | -32.98 | 49.65 | 24.49 | 24.49 | 24.49 | 24.49 | 24.49 |
| EBITDA | 24.3 | -3.7 | -2.6 | -5.9 | .7 | -3.0 | -3.7 | -4.6 | -5.7 | -7.1 |
| EBITDA, % | 13.22 | -15.58 | -5.75 | -19.29 | 1.46 | -5.19 | -5.19 | -5.19 | -5.19 | -5.19 |
| Depreciation | .9 | 1.0 | 1.2 | .0 | .9 | 1.0 | 1.3 | 1.6 | 2.0 | 2.5 |
| Depreciation, % | 0.4955 | 4.05 | 2.58 | -0.05309012 | 1.87 | 1.79 | 1.79 | 1.79 | 1.79 | 1.79 |
| EBIT | 23.4 | -4.7 | -3.8 | -5.9 | -.2 | -4.0 | -5.0 | -6.2 | -7.7 | -9.6 |
| EBIT, % | 12.73 | -19.62 | -8.34 | -19.23 | -0.40272 | -6.97 | -6.97 | -6.97 | -6.97 | -6.97 |
| Total Cash | 51.2 | 42.6 | 39.0 | 37.5 | 40.6 | 46.0 | 57.3 | 71.3 | 88.7 | 110.5 |
| Total Cash, percent | .0 | .0 | .0 | .0 | .0 | .0 | .0 | .0 | .0 | .0 |
| Account Receivables | 2.6 | 1.4 | 9.1 | 1.2 | 2.0 | 4.0 | 5.0 | 6.2 | 7.7 | 9.6 |
| Account Receivables, % | 1.41 | 5.68 | 19.71 | 3.75 | 4.32 | 6.97 | 6.97 | 6.97 | 6.97 | 6.97 |
| Inventories | 1.0 | 4.2 | 3.7 | 1.4 | 2.4 | 4.1 | 5.1 | 6.4 | 8.0 | 9.9 |
| Inventories, % | 0.52984 | 17.49 | 8.14 | 4.63 | 5.12 | 7.18 | 7.18 | 7.18 | 7.18 | 7.18 |
| Accounts Payable | 9.7 | 8.1 | 13.0 | 7.3 | 8.1 | 12.5 | 15.5 | 19.3 | 24.0 | 29.9 |
| Accounts Payable, % | 5.28 | 33.93 | 28.18 | 23.58 | 17.62 | 21.72 | 21.72 | 21.72 | 21.72 | 21.72 |
| Capital Expenditure | -.7 | -.7 | -1.7 | -.2 | .0 | -.9 | -1.1 | -1.4 | -1.7 | -2.2 |
| Capital Expenditure, % | -0.39019 | -3.02 | -3.74 | -0.60453 | -0.07109395 | -1.56 | -1.56 | -1.56 | -1.56 | -1.56 |
| Tax Rate, % | -30.98 | -30.98 | -30.98 | -30.98 | -30.98 | -30.98 | -30.98 | -30.98 | -30.98 | -30.98 |
| EBITAT | 17.7 | -3.8 | -2.9 | -4.6 | -.2 | -3.3 | -4.1 | -5.1 | -6.3 | -7.8 |
| Depreciation | ||||||||||
| Changes in Account Receivables | ||||||||||
| Changes in Inventories | ||||||||||
| Changes in Accounts Payable | ||||||||||
| Capital Expenditure | ||||||||||
| UFCF | 24.0 | -7.1 | -5.8 | -.3 | -.3 | -2.6 | -2.8 | -3.5 | -4.4 | -5.5 |
| WACC, % | 4.81 | 4.81 | 4.81 | 4.81 | 4.83 | 4.81 | 4.81 | 4.81 | 4.81 | 4.81 |
| PV UFCF | ||||||||||
| SUM PV UFCF | -16.1 | |||||||||
| Long Term Growth Rate, % | 4.00 | |||||||||
| Free cash flow (T + 1) | -6 | |||||||||
| Terminal Value | -701 | |||||||||
| Present Terminal Value | -554 | |||||||||
| Enterprise Value | -570 | |||||||||
| Net Debt | -13 | |||||||||
| Equity Value | -557 | |||||||||
| Diluted Shares Outstanding, MM | 12 | |||||||||
| Equity Value Per Share | -47.26 |
What You Will Receive
- Customizable Excel Template: A fully adaptable Excel-based DCF Calculator featuring pre-filled financials for FKWL.
- Actual Data: Historical performance metrics and forward-looking projections (highlighted in the yellow cells).
- Forecast Adaptability: Modify key assumptions such as revenue growth, EBITDA %, and WACC.
- Instant Calculations: Quickly observe how your inputs affect Franklin Wireless Corp.'s valuation.
- Professional Resource: Designed for investors, CFOs, consultants, and financial analysts.
- Intuitive Layout: Organized for clarity and ease of navigation, complete with step-by-step guidance.
Key Features
- 🔍 Real-Life FKWL Financials: Pre-filled historical and projected data for Franklin Wireless Corp.
- ✏️ Fully Customizable Inputs: Adjust all critical parameters (yellow cells) like WACC, growth %, and tax rates.
- 📊 Professional DCF Valuation: Built-in formulas calculate Franklin’s intrinsic value using the Discounted Cash Flow method.
- ⚡ Instant Results: Visualize Franklin’s valuation instantly after making changes.
- Scenario Analysis: Test and compare outcomes for various financial assumptions side-by-side.
How It Works
- 1. Access the Template: Download and open the Excel file featuring Franklin Wireless Corp. (FKWL) preloaded data.
- 2. Modify Assumptions: Adjust key inputs such as growth rates, WACC, and capital expenditures.
- 3. View Results in Real-Time: The DCF model automatically calculates intrinsic value and NPV.
- 4. Experiment with Scenarios: Analyze various forecasts to evaluate different valuation results.
- 5. Present with Assurance: Share professional valuation insights to enhance your decision-making process.
Why Choose the Franklin Wireless Corp. (FKWL) Calculator?
- Accuracy: Utilizes real Franklin Wireless financial data for precise calculations.
- Flexibility: Tailored for users to easily adjust and experiment with inputs.
- Time-Saving: Avoid the complexities of creating a DCF model from the ground up.
- Professional-Grade: Crafted with the expertise and usability expected at the CFO level.
- User-Friendly: Intuitive interface designed for users of all financial backgrounds.
Who Should Use This Product?
- Professional Investors: Develop comprehensive and trustworthy valuation models for portfolio management related to Franklin Wireless Corp. (FKWL).
- Corporate Finance Teams: Evaluate valuation scenarios to inform strategic planning within their organizations.
- Consultants and Advisors: Deliver precise valuation insights to clients focused on Franklin Wireless Corp. (FKWL).
- Students and Educators: Utilize real-time data to enhance financial modeling skills in educational settings.
- Tech Enthusiasts: Gain insights into the market valuation processes of technology companies like Franklin Wireless Corp. (FKWL).
What the Template Contains
- Pre-Filled DCF Model: Franklin Wireless Corp.’s (FKWL) financial data preloaded for immediate use.
- WACC Calculator: Detailed calculations for Weighted Average Cost of Capital.
- Financial Ratios: Evaluate Franklin Wireless Corp.’s (FKWL) profitability, leverage, and efficiency.
- Editable Inputs: Change assumptions such as growth, margins, and CAPEX to fit your scenarios.
- Financial Statements: Annual and quarterly reports to support detailed analysis.
- Interactive Dashboard: Easily visualize key valuation metrics and results.
Disclaimer
All information, articles, and product details provided on this website are for general informational and educational purposes only. We do not claim any ownership over, nor do we intend to infringe upon, any trademarks, copyrights, logos, brand names, or other intellectual property mentioned or depicted on this site. Such intellectual property remains the property of its respective owners, and any references here are made solely for identification or informational purposes, without implying any affiliation, endorsement, or partnership.
We make no representations or warranties, express or implied, regarding the accuracy, completeness, or suitability of any content or products presented. Nothing on this website should be construed as legal, tax, investment, financial, medical, or other professional advice. In addition, no part of this site—including articles or product references—constitutes a solicitation, recommendation, endorsement, advertisement, or offer to buy or sell any securities, franchises, or other financial instruments, particularly in jurisdictions where such activity would be unlawful.
All content is of a general nature and may not address the specific circumstances of any individual or entity. It is not a substitute for professional advice or services. Any actions you take based on the information provided here are strictly at your own risk. You accept full responsibility for any decisions or outcomes arising from your use of this website and agree to release us from any liability in connection with your use of, or reliance upon, the content or products found herein.