
|
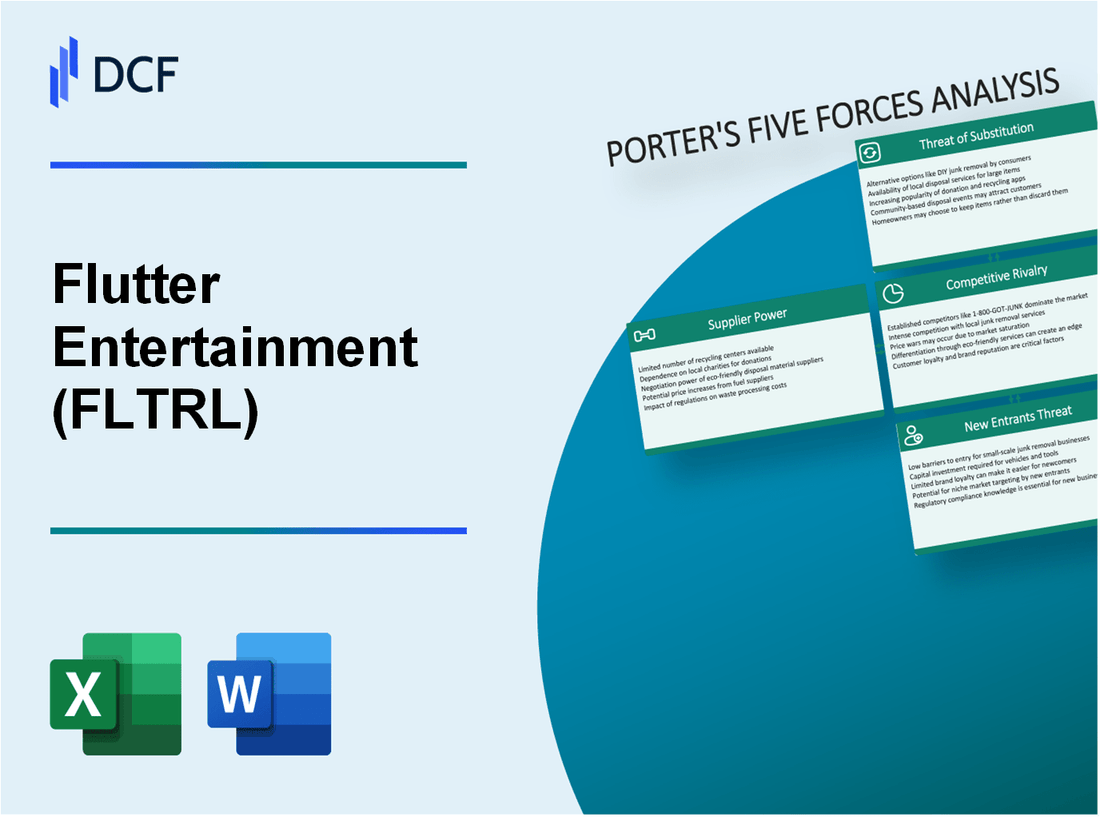
Flutter Entertainment plc (FLTR.L): 5 FORCES Analysis [Apr-2026 Updated] |
Entièrement Modifiable: Adapté À Vos Besoins Dans Excel Ou Sheets
Conception Professionnelle: Modèles Fiables Et Conformes Aux Normes Du Secteur
Pré-Construits Pour Une Utilisation Rapide Et Efficace
Compatible MAC/PC, entièrement débloqué
Aucune Expertise N'Est Requise; Facile À Suivre
Flutter Entertainment plc (FLTR.L) Bundle
Using Michael Porter's Five Forces, this piece cuts through the noise to reveal how Flutter Entertainment-backed by massive tech investment, global scale and FanDuel's US dominance-navigates powerful suppliers (data, media, payments), demanding and price‑sensitive customers, ferocious rivals and well‑funded challengers, enduring substitutes from land casinos and digital alternatives, and steep barriers that deter new entrants; read on to see which forces most threaten Flutter's margins and which cement its market moat.
Flutter Entertainment plc (FLTR.L) - Porter's Five Forces: Bargaining power of suppliers
Proprietary technology investment reduces reliance on third-party software vendors significantly. Flutter allocated approximately $820 million to technology research and development in fiscal 2024 to support its global workforce of 7,700 technologists. This internal capability allows the company to operate proprietary platforms like the 'Your Way' customizable betting system, which reduces the bargaining leverage of external B2B gaming providers.
By owning its core tech stack, Flutter achieves operating cost synergies, such as the expected €70 million saved through the integration of Sisal and SNAI technology. The company's 'Flutter Edge' strategy ensures that its local brands benefit from group-wide proprietary innovations rather than external licenses. Consequently, the supplier power of specialized software firms is mitigated by Flutter's massive internal CAPEX and technical scale, lowering the effective price sensitivity to external platform vendors.
Data feed providers maintain moderate leverage due to the essential nature of live sports information. Flutter relies on a small group of key data providers like Sportradar and Genius Sports to power its real-time betting markets across 30 regulated jurisdictions. These suppliers provide critical low-latency data for over $40 billion in sports bets wagered during the first half of 2025 alone.
While Flutter is a massive customer, the high concentration of these data rights holders means they can demand significant fees for exclusive or high-speed feeds. Flutter's scale as the world's largest online betting company gives it a volume-based advantage during contract negotiations. The necessity of these feeds for FanDuel's 43% US sportsbook market share keeps supplier power relevant but manageable.
Media partnerships act as critical suppliers of customer acquisition and brand visibility. Flutter leverages strategic media agreements, such as its partnership with the NBA and various broadcasting networks, to maintain FanDuel's leading position. These suppliers control access to sports audiences, and the cost of these partnerships is reflected in Flutter's massive marketing spend, which reached approximately £820 million in 2023.
The bargaining power of these media entities is high because they own the rights to the most valuable advertising slots during live events like the Super Bowl. FanDuel's 2025 Super Bowl performance-3 million active customers placing 17.7 million bets-underscores the reliance on these high-profile media suppliers. Despite the high costs, Flutter's financial strength allows it to outbid smaller rivals for these essential promotional channels.
Payment processors and financial institutions exert influence through transaction fees and compliance requirements. Flutter processes billions in wagers, with its US division alone projected to generate between $7.47 billion and $7.97 billion in revenue for 2025. Payment suppliers like Visa, Mastercard, and digital wallet providers charge transaction fees that directly impact the company's net margins.
These suppliers also enforce strict anti-money laundering (AML) and 'Know Your Customer' (KYC) protocols that Flutter must integrate into its platforms. While Flutter's high transaction volume provides some leverage to negotiate lower processing rates, the essential nature of these services makes them a non-negotiable supplier group. The company's 2.2x leverage ratio as of late 2024 demonstrates a healthy balance sheet that helps in managing these financial supplier relationships.
| Supplier Category | Key Suppliers | Nature of Power (High/Moderate/Low) | Quantitative Metrics | Mitigating Factors |
|---|---|---|---|---|
| Proprietary Tech / Platform | Internal R&D, 'Your Way', Flutter Edge | Low | $820m R&D (2024); 7,700 technologists; €70m integration savings | Internal CAPEX, in-house platforms, scale economies |
| Data Feed Providers | Sportradar, Genius Sports | Moderate | $40bn sports bets H1 2025; 30 regulated jurisdictions; FanDuel 43% US market share | Volume leverage in procurement; diversification where possible |
| Media / Rights Partners | NBA, major broadcasters | High | £820m marketing spend (2023); 3m active Super Bowl customers; 17.7m Super Bowl bets (2025) | Financial capacity to outbid rivals; strategic long-term deals |
| Payment Processors & Banks | Visa, Mastercard, digital wallets | Moderate to High | US revenue $7.47-$7.97bn (2025 proj.); processing fees impact margins; 2.2x leverage (late 2024) | High transaction volume; negotiated rates; robust compliance infrastructure |
- Net effect: supplier power is heterogeneous-low for proprietary tech, moderate for data and payments, high for premium media rights.
- Key financial levers: $820m R&D, £820m marketing, €70m integration savings, $40bn bets H1 2025, US revenue projection $7.47-$7.97bn (2025).
- Strategic responses: invest in internal tech, contract diversification for feeds, long-term media partnerships, negotiate payment rates leveraging volume.
Flutter Entertainment plc (FLTR.L) - Porter's Five Forces: Bargaining power of customers
Low switching costs for individual bettors increase the bargaining power of the consumer. Customers can easily move between platforms such as FanDuel, DraftKings, and BetMGM, often driven by the most attractive odds or promotional offers. Flutter reports an average monthly retention rate of 99% across core markets, supported by AI-driven personalized recommendations and loyalty programs. The company's marketing strategy involves significant investment in promotional 'generosity' - for example, Bet Back Tokens and free-to-play offers that incentivize repeat play. Despite high retention metrics, the industry-average customer acquisition cost (CAC) remains between $200 and $400 per user, forcing ongoing investment in product, marketing, and promotions to prevent churn in a highly mobile user base.
| Metric | Value | Source / Note |
|---|---|---|
| Average monthly retention | 99% | Flutter reported AI-driven personalization and loyalty programs |
| Customer acquisition cost (industry range) | $200-$400 per user | Industry benchmark for US sportsbook/iGaming |
| Annual revenue (FY 2024) | $14.0 billion | Company consolidated revenue |
High price sensitivity regarding betting odds and promotional 'generosity' empowers the player base. Consumers respond strongly to promotional incentives, a key tool for maintaining FanDuel's ~43% US sportsbook market share. In Q4 2024, unusually customer-friendly NFL results (favorites winning at the highest rate in 20 years) produced a $438 million negative impact on gross gaming revenue (GGR), illustrating how collective player outcomes can materially affect short-term profitability. To manage volatility, Flutter targets a long-term structural hold of 16% by 2030, yet current market conditions continue to require elevated promotional spend and competitive pricing (odds) to defend share.
- US sportsbook market share (FanDuel): ~43%
- Q4 2024 NFL results impact on GGR: -$438 million
- Target structural hold: 16% by 2030
- Ongoing promotional pressure: high - elevates customer bargaining power
Increasing demand for integrated and personalized gaming experiences drives product development and raises customer expectations. Sophisticated product features such as Same Game Parlays and the 'Your Way' platform have increased engagement - NFL parlay penetration rose by 500 basis points where these products were promoted. Global average monthly players (AMPs) grew 13% to 13.9 million in 2024, reflecting a large, engaged, but demanding user base. iGaming momentum is significant: FanDuel iGaming revenue surged ~43% in late 2024, indicating customer migration toward higher-frequency digital casino products that boost lifetime value but require continuous innovation in UX, markets, and personalization to retain users and justify CAC.
| Product / Metric | Change | Implication |
|---|---|---|
| Global AMPs | 13.9 million (+13% YoY) | Large, growing user base demanding new features |
| NFL parlay penetration (Your Way / SGP) | +500 basis points | Higher engagement and cross-sell to iGaming |
| FanDuel iGaming revenue (late 2024) | +43% YoY | Shift to high-frequency digital casino products |
Regulatory protections and responsible gaming tools provide customers with institutional bargaining power. Governments in key markets such as the UK and several US states are imposing strict consumer protection measures - examples include £500 monthly spending limits for users under 25 in some UK regions. Flutter's 'My Spend' dashboard is used by 3.5 million FanDuel customers, demonstrating migration toward consumer-controlled spending environments. These regulations constrain monetization of high-value players and introduce compliance costs; Flutter anticipates over $100 million in EBITDA headwinds due to tax changes and regulatory shifts across multiple US states by 2025. The combined effect of regulation and responsible-gaming tooling shifts power to consumers and regulators, limiting aggressive yield-seeking behavior by operators.
- 'My Spend' users: 3.5 million FanDuel customers
- Regulatory spending limit example: £500/month for under-25s (selected UK regions)
- Estimated regulatory/tax EBITDA headwind by 2025: >$100 million
Net effect: customers hold elevated bargaining power driven by low switching costs, price sensitivity to odds and promotions, demand for sophisticated products, and institutional protections enforced by regulators. Flutter's strategic responses include heavy investment in personalization (AI), loyalty mechanics (Bet Back Tokens), diversified product suites (SGPs, iGaming), and compliance tools (My Spend), all aimed at preserving ARPU and lifetime value in a market where consumers and regulators jointly exert substantial influence.
Flutter Entertainment plc (FLTR.L) - Porter's Five Forces: Competitive rivalry
Intense rivalry between market leaders FanDuel and DraftKings dominates the US landscape. As of mid-2025, FanDuel held a 34.0% gross gaming revenue (GGR) share of all US sports betting, while DraftKings held 32.1%, combining for a 66.1% duopolistic share. FanDuel's reported record hold rate of 14.5% in Q4 2024 amplified short-term GGR but also intensified promotional and liability management actions across operators. Flutter's US revenue is projected at $7.72 billion for 2025, representing a 33% year-over-year increase, reflecting both organic growth and market share defense investments. The rivalry is characterized by aggressive promotional spending, liability management, and a technology arms race, which keeps operating margins under pressure despite scale advantages.
| Metric | FanDuel (mid-2025) | DraftKings (mid-2025) | Flutter (2024/2025) |
|---|---|---|---|
| US sports betting GGR share | 34.0% | 32.1% | - (group combined US share embedded in US revenue) |
| Combined top-two market share (US) | 66.1% | ||
| FanDuel Q4 2024 hold rate | 14.5% | - | - |
| Flutter US revenue (projected 2025) | - | - | $7.72 billion (33% YoY) |
| Group revenue (2024) | - | - | $14.05 billion (19% YoY) |
| Cash position (late 2024) | - | - | $1.53 billion |
Global diversification provides a buffer against localized competitive pressures in mature markets. Flutter retains 'gold medal' positions in the UK, Ireland, Italy, and Australia - markets that collectively contributed approximately 90% of the company's revenue base when accounting for mature-market stability and scale economies. Italy showed particular outperformance: Sisal's online revenue grew 39% in 2024. The UK & Ireland division gained four percentage points of market share over a two-year period to strengthen recurring revenue streams. These established revenue pools enable reinvestment into higher-growth jurisdictions and strategic M&A.
| Region/Brand | 2024 Performance | Notes |
|---|---|---|
| Italy (Sisal) | Online revenue +39% (2024) | Local leadership driving regional online growth |
| UK & Ireland | Market share +4 percentage points (2 yrs) | Stable cash generation and promotional efficiency |
| Australia | "Gold medal" market position | High margin retail & online mix |
| Brazil (NSX stake) | 56% acquisition stake (recent) | High-growth market investment via local partner |
- Geographic scale: revenue diversification across mature and emerging markets reduces single-market dependency.
- Reinvestment capability: profits from UK/Ireland/Italy/Australia fund US competition and new market entries.
- Risk mitigation: regulatory or hold-rate volatility in one market is offset by performance elsewhere.
Consolidation and M&A activity are core strategic levers to neutralize competitors and acquire scale. Recent acquisitions include MaxBet (Serbia) and SNAI (Italy), bolstering local leadership and eliminating mid-tier threats. Flutter's 2025 guidance targets $17.26 billion in group revenue, reflecting expected contributions from these integrations and continued market expansion. The company reported an average monthly active player base of 13.9 million, a metric that acquisition-led customer base expansions directly supports. Flutter's strong cash position ($1.53 billion as of late 2024) and free cash flow generation enable continued M&A-driven market consolidation.
| Acquisition | Target Market | Strategic Effect |
|---|---|---|
| MaxBet | Serbia | Immediate local market share increase; regional growth platform |
| SNAI | Italy | Strengthened Italian leadership; cross-sell to existing customers |
| NSX stake | Brazil (56% stake) | Entry into high-growth Latin American market |
New challenger brands and media-backed entrants materially increase competitive intensity. Fanatics reached a 7.9% US market share by mid-2025, while ESPN Bet and other media-affiliated entrants leverage brand equity, distribution partnerships, and large customer databases to lower CAC and accelerate scale. Flutter defends by deepening product moats - for example, achieving a 26% market share in the US iGaming sector, which grew 43% in Q4 2024 - and leveraging its 'Flutter Edge' technology to optimize player lifetime value and reduce marginal acquisition costs.
| Challenger | Mid-2025 market share (US) | Flutter defensive metrics |
|---|---|---|
| Fanatics | 7.9% | Flutter US iGaming share 26%; iGaming growth +43% (Q4 2024) |
| ESPN Bet | - (growing entrant) | Brand partnerships and tech investment to protect market share |
| Smaller challengers | Remaining market | Targeted M&A or niche strategies required to compete |
- Customer acquisition: media-backed entrants reduce CAC by leveraging owned audiences.
- Product innovation: continuous tech upgrades and iGaming offerings required to retain engagement.
- Promotional arms race: sustained high promotional intensity compresses short-term margins.
- M&A as deflection: acquiring local heroes prevents fragmentation and defends pricing power.
Overall, the competitive rivalry facing Flutter is multifaceted: a duopolistic US market with FanDuel and DraftKings aggressively contesting share; an expanding set of well-funded challengers leveraging brand equity; and a strategic reliance on global diversification and M&A to preserve leadership. Key quantitative pressures include maintaining US revenue growth to $7.72 billion in 2025, integrating acquisitions to meet $17.26 billion group revenue guidance, managing promotional spend against record hold rate volatility, and deploying $1.53 billion in cash and operating cash flow to fund strategic plays while protecting margins.
Flutter Entertainment plc (FLTR.L) - Porter's Five Forces: Threat of substitutes
Land-based casinos and traditional lotteries remain significant physical substitutes for online gaming. In the United States, land-based casinos generated approximately $61.5 billion in revenue in 2023, representing a massive pool of discretionary spending that competes with Flutter's digital platforms. While online gambling is growing, many consumers still prefer the social and physical experience of a retail casino. Flutter addresses this by expanding its iGaming portfolio, which reached an estimated 26% market share in the US by late 2024. The global gambling market was valued at $660 billion in 2024, indicating that Flutter's approximately $14 billion revenue is still a small fraction of the total betting wallet. The convenience of mobile betting is the primary tool Flutter uses to cannibalize these traditional substitutes.
Key comparative metrics for major substitutes:
| Substitute | 2023/2024 Market Value (USD) | Flutter relevance (2024/2025) | Primary competitive lever |
|---|---|---|---|
| Land-based casinos (US) | $61.5 billion (2023 revenue) | High - direct consumer spend competitor | Social/physical experience vs mobile convenience |
| Traditional lotteries (global) | $xx.x billion (component of $660B global market) | Moderate - large, habitual spend category | Broad distribution and offline penetration |
| Online sportsbooks & iGaming | Part of $660B global; Flutter revenue ~$14B (2024) | Own category - market share growth (iGaming 26% in US) | Mobile UX, pricing, promotions, product breadth |
| Prediction markets (Kalshi, Polymarket) | Rapid growth; Kalshi volume x3 in Sep 2025 vs earlier 2025 | Emerging threat; Flutter exploring 'FanDuel Predict' | Event-based contracts, different regs, younger user base |
| Social & video gaming (Fortnite, streaming) | Global gaming market hundreds of billions; microtransaction growth double-digit | Competes for time and discretionary spend; Flutter saw +15% avg monthly players Q4 2024 | Gamification, social features, microtransactions |
| Black market / unregulated operators | Opaque; significant share in price-sensitive segments | Structural threat in multiple jurisdictions; Flutter in 30+ regulated markets | Lower cost, better odds vs regulated safety and compliance |
Prediction markets and event-based contracts are emerging as a novel digital substitute. Platforms like Kalshi and Polymarket have recorded rapid volume growth, with Kalshi's September 2025 trading volume increasing roughly threefold compared to earlier months in 2025. These markets operate under different regulatory frameworks and in some states permit participants aged 18+, creating a demographic and regulatory mismatch with state-limited sports betting (21+). Flutter's CEO has publicly acknowledged this threat; the company is piloting and developing 'FanDuel Predict' and anticipates capital allocation in this area. Management guidance signals a targeted investment of $200 million to $300 million in 2026 to build prediction market offerings and related technology stacks. Strategic uncertainty remains over whether prediction markets expand the total entertainment wallet or merely reallocate spending away from traditional sportsbooks.
Social media and video gaming compete directly for the same 'entertainment time' and discretionary spend. Younger demographics increasingly allocate wallet and attention to free-to-play titles with monetization through skins, battle passes, and microtransactions (industry growth in microtransaction revenues reported in double digits across 2022-2024). Flutter has responded by gamifying its apps, integrating social features, and deploying AI-driven product recommendation engines that mimic social media algorithms; these measures correlate with a 15% rise in average monthly players in Q4 2024. Despite gains, the persistence of free-to-play engagement models and the lower friction of non-monetized social content remain a durable substitute.
Bulleted tactical and strategic responses to digital entertainment substitutes:
- Product gamification and social features to increase engagement and session length.
- AI-driven personalization to improve monetization per user and mimic social feed dynamics.
- Targeted marketing to younger cohorts while maintaining compliance constraints.
- Investment ($200M-$300M in 2026) to launch or scale prediction market products.
Illegal or unregulated 'black market' operators pose a structural substitute threat to regulated platforms. Unregulated sites often offer superior odds or higher bet limits because they avoid taxes and compliance costs that regulated operators, including Flutter, must incur. Flutter operates in more than 30 regulated markets and must navigate complex tax and regulatory environments; management projects an incremental tax uplift of about $200 million in 2026 driven by state-level changes in the US and other jurisdictional tax adjustments. Price-sensitive or high-stakes bettors may gravitate toward black-market offerings to bypass limits and KYC requirements. Flutter's defense strategy centers on emphasizing security, rapid payouts, verified liquidity, and responsible gaming tools across its regulated brands, leveraging scale and proprietary 'Flutter Edge' technology to offset the comparative cost disadvantage of regulated operation.
Operational and risk mitigation measures against black-market substitution:
- Investment in compliance, monitoring, and anti-fraud technologies to detect and deter illegal operators.
- Customer education on payout security and legal protections in regulated platforms.
- Lobbying and collaboration with regulators to close jurisdictional loopholes and raise barriers to unregulated operators.
Flutter Entertainment plc (FLTR.L) - Porter's Five Forces: Threat of new entrants
High regulatory barriers and licensing costs create a formidable entry barrier for prospective competitors. To operate as a gaming company, firms face rigorous background checks, anti-money laundering controls, know-your-customer requirements, and complex cybersecurity and integrity measures. In the US, licensing is state-by-state: the cumulative cost of obtaining and maintaining licenses across multiple states, plus ongoing compliance spending, is frequently prohibitive for startups. Flutter's targeted expansion into Missouri and Alberta is forecast to incur approximately $90 million in incremental opening and compliance costs in 2025 alone. Differential state tax regimes-examples include Illinois and New Jersey-produce a "tax hurdle" that favors well-capitalized incumbents able to absorb higher effective tax burdens during growth periods. These regulatory moats help protect Flutter's ~43% sportsbook market share from fragmentation by small-scale entrants.
Massive capital requirements for customer acquisition and technology produce a high "cost of entry." New entrants typically must spend hundreds of millions of dollars on marketing and promotions to build meaningful brand recognition and scale. FanDuel and DraftKings have invested multi-billion dollar marketing war chests and established brand equity; FanDuel's multibillion-dollar brand value benchmarks the level of spend required. Flutter's technology and product R&D spend was $820 million in 2024, underpinning platforms capable of handling millions of concurrent users during peak sporting events. Industry economics show an average payback period on new customers of under 18 months, forcing entrants to fund substantial early losses. Even large, well-funded challengers such as Fanatics required heavy upfront capital to achieve only a 7.9% market share, illustrating the scale of investment required to move market share materially.
The following table summarizes key capital, cost, and scale metrics that raise the cost of entry for new competitors:
| Metric | Flutter (FY2024) | Industry / Comparator | Implication for Entrants |
|---|---|---|---|
| R&D / Technology Spend | $820 million | Industry leading | High technical baseline to match platform stability and speed |
| Forecasted 2025 market entry costs (MO & AB) | $90 million | NA | Significant upfront regulatory and go-to-market costs |
| Sportsbook market share (US) | ~43% | Duopoly with DraftKings | Large incumbency advantage; smaller room for new entrants |
| Adjusted EBITDA margin | 16.8% | Sector median lower | Operational efficiency enables promotional flexibility |
| Players (active) | 13.9 million | Global scale | Spreads fixed costs; improves unit economics vs. entrants |
| Cash on hand | $1.53 billion | Strong liquidity | Ability to sustain promotional wars and M&A |
| Leverage ratio | 2.2x | Moderate | Capacity to deploy additional capital defensively |
| New customer payback period | N/A (industry avg) | <18 months | Requires deep pockets to fund early losses |
Economies of scale and what can be termed the "Flutter Edge" deliver a pronounced cost advantage over new players. Flutter's fixed technology, product development, and corporate costs are distributed across approximately 13.9 million active players, supporting superior unit economics and a structural EBITDA margin (adjusted) of 16.8% in fiscal 2024. New entrants lack the extensive historical datasets and refined AI/odds models that Flutter leverages to achieve an industry-level structural hold rate of about 14.5%. With $1.53 billion of cash and a 2.2x leverage ratio, Flutter has the financial firepower to amplify promotional spend and absorb margin pressure to defend share. The cumulative effect of scale, data, and balance sheet strength increases the effective cost of entry for challengers and reduces the attractiveness of the market to firms without pre-existing global infrastructure.
Established brand loyalty and first-mover advantages in regulated states further constrain new competitor growth. FanDuel (a Flutter brand) was among the earliest mobile-first entrants in the US market, translating into durable brand recognition and consumer trust. States where FanDuel launched earlier still recorded revenue growth-FanDuel saw a 9% revenue increase in late 2024 in mature states-indicating the persistence of incumbency benefits. User switching costs are material: balances, loyalty points, personalized product configurations, and behavioral familiarity reduce the propensity to migrate. Flutter reports a monthly retention rate near 99%, evidencing customer stickiness. Market concentration-FanDuel plus DraftKings controlling roughly 65% of US sports betting revenue-leaves limited room for new brands to scale without either significant differentiation or deep pockets.
- Regulatory/compliance: continuous expenditure on licensing, KYC/AML, integrity monitoring.
- Marketing/customer acquisition: hundreds of millions required to reach breakout scale.
- Technology/data: large upfront and ongoing R&D to match latency, reliability, and personalization.
- Balance sheet strength: necessary to endure negative cash flow while acquiring customers.
- Brand/retention: incumbency and high retention rates raise switching costs for consumers.
Disclaimer
All information, articles, and product details provided on this website are for general informational and educational purposes only. We do not claim any ownership over, nor do we intend to infringe upon, any trademarks, copyrights, logos, brand names, or other intellectual property mentioned or depicted on this site. Such intellectual property remains the property of its respective owners, and any references here are made solely for identification or informational purposes, without implying any affiliation, endorsement, or partnership.
We make no representations or warranties, express or implied, regarding the accuracy, completeness, or suitability of any content or products presented. Nothing on this website should be construed as legal, tax, investment, financial, medical, or other professional advice. In addition, no part of this site—including articles or product references—constitutes a solicitation, recommendation, endorsement, advertisement, or offer to buy or sell any securities, franchises, or other financial instruments, particularly in jurisdictions where such activity would be unlawful.
All content is of a general nature and may not address the specific circumstances of any individual or entity. It is not a substitute for professional advice or services. Any actions you take based on the information provided here are strictly at your own risk. You accept full responsibility for any decisions or outcomes arising from your use of this website and agree to release us from any liability in connection with your use of, or reliance upon, the content or products found herein.