
|
Forestar Group Inc. (For) Valation DCF |
Entièrement Modifiable: Adapté À Vos Besoins Dans Excel Ou Sheets
Conception Professionnelle: Modèles Fiables Et Conformes Aux Normes Du Secteur
Pré-Construits Pour Une Utilisation Rapide Et Efficace
Compatible MAC/PC, entièrement débloqué
Aucune Expertise N'Est Requise; Facile À Suivre
Forestar Group Inc. (FOR) Bundle
Gardez un aperçu de votre analyse d'évaluation de votre Forestar Group Inc. (pour) avec notre calculatrice sophistiquée DCF! Préchargé avec des données réelles (pour), ce modèle Excel vous permet d'ajuster les prévisions et les hypothèses pour déterminer la valeur intrinsèque de Forestar Group Inc. (pour) avec précision.
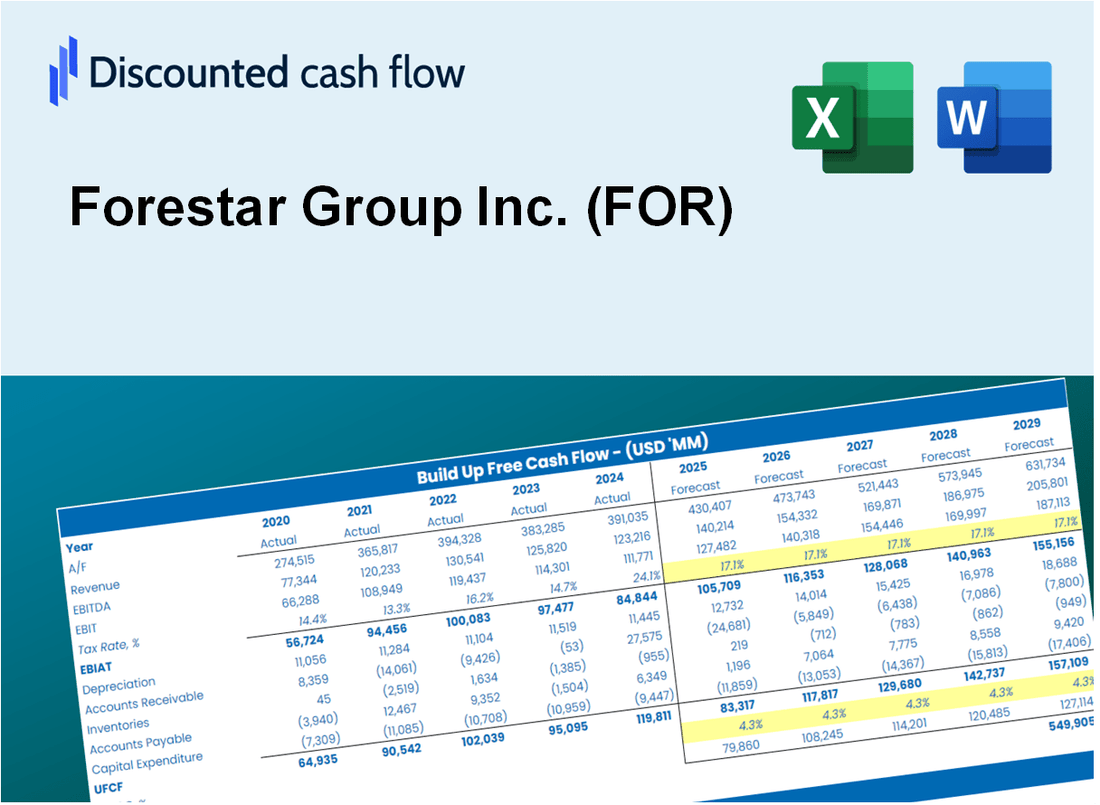
Discounted Cash Flow (DCF) - (USD MM)
| Year | AY1 2020 |
AY2 2021 |
AY3 2022 |
AY4 2023 |
AY5 2024 |
FY1 2025 |
FY2 2026 |
FY3 2027 |
FY4 2028 |
FY5 2029 |
|---|---|---|---|---|---|---|---|---|---|---|
| Revenue | 931.8 | 1,325.8 | 1,519.1 | 1,436.9 | 1,509.4 | 1,722.6 | 1,965.9 | 2,243.6 | 2,560.5 | 2,922.1 |
| Revenue Growth, % | 0 | 42.28 | 14.58 | -5.41 | 5.05 | 14.12 | 14.12 | 14.12 | 14.12 | 14.12 |
| EBITDA | 77.3 | 163.5 | 236.9 | 233.4 | 243.8 | 236.4 | 269.8 | 307.9 | 351.4 | 401.0 |
| EBITDA, % | 8.3 | 12.33 | 15.59 | 16.24 | 16.15 | 13.72 | 13.72 | 13.72 | 13.72 | 13.72 |
| Depreciation | 859.3 | 2.7 | 2.7 | 3.0 | 3.0 | 320.4 | 365.7 | 417.3 | 476.3 | 543.6 |
| Depreciation, % | 92.22 | 0.20365 | 0.17774 | 0.20878 | 0.19875 | 18.6 | 18.6 | 18.6 | 18.6 | 18.6 |
| EBIT | -782.0 | 160.8 | 234.2 | 230.4 | 240.8 | -84.0 | -95.9 | -109.4 | -124.9 | -142.5 |
| EBIT, % | -83.92 | 12.13 | 15.42 | 16.03 | 15.95 | -4.88 | -4.88 | -4.88 | -4.88 | -4.88 |
| Total Cash | 394.3 | 153.6 | 264.8 | 616.0 | 481.2 | 503.3 | 574.4 | 655.5 | 748.1 | 853.7 |
| Total Cash, percent | .0 | .0 | .0 | .0 | .0 | .0 | .0 | .0 | .0 | .0 |
| Account Receivables | 6.3 | 1.1 | 11.4 | 25.7 | 37.3 | 19.9 | 22.7 | 25.9 | 29.5 | 33.7 |
| Account Receivables, % | 0.67611 | 0.08296877 | 0.75044 | 1.79 | 2.47 | 1.15 | 1.15 | 1.15 | 1.15 | 1.15 |
| Inventories | -10.4 | .0 | -40.3 | .0 | .0 | -13.0 | -14.8 | -16.9 | -19.3 | -22.0 |
| Inventories, % | -1.12 | 0 | -2.65 | 0 | 0 | -0.7538 | -0.7538 | -0.7538 | -0.7538 | -0.7538 |
| Accounts Payable | 29.2 | 47.4 | 72.2 | 68.4 | 85.9 | 75.5 | 86.2 | 98.3 | 112.2 | 128.1 |
| Accounts Payable, % | 3.13 | 3.58 | 4.75 | 4.76 | 5.69 | 4.38 | 4.38 | 4.38 | 4.38 | 4.38 |
| Capital Expenditure | -.6 | -1.6 | -3.5 | -1.3 | -2.2 | -2.2 | -2.6 | -2.9 | -3.3 | -3.8 |
| Capital Expenditure, % | -0.0643915 | -0.12068 | -0.2304 | -0.09047255 | -0.14575 | -0.13034 | -0.13034 | -0.13034 | -0.13034 | -0.13034 |
| Tax Rate, % | 24.69 | 24.69 | 24.69 | 24.69 | 24.69 | 24.69 | 24.69 | 24.69 | 24.69 | 24.69 |
| EBITAT | -608.8 | 120.9 | 177.6 | 173.5 | 181.3 | -63.8 | -72.8 | -83.1 | -94.8 | -108.2 |
| Depreciation | ||||||||||
| Changes in Account Receivables | ||||||||||
| Changes in Inventories | ||||||||||
| Changes in Accounts Payable | ||||||||||
| Capital Expenditure | ||||||||||
| UFCF | 283.2 | 135.0 | 231.6 | 116.8 | 188.0 | 274.4 | 300.0 | 342.4 | 390.8 | 446.0 |
| WACC, % | 7.67 | 7.63 | 7.64 | 7.64 | 7.64 | 7.64 | 7.64 | 7.64 | 7.64 | 7.64 |
| PV UFCF | ||||||||||
| SUM PV UFCF | 1,388.0 | |||||||||
| Long Term Growth Rate, % | 0.50 | |||||||||
| Free cash flow (T + 1) | 448 | |||||||||
| Terminal Value | 6,274 | |||||||||
| Present Terminal Value | 4,341 | |||||||||
| Enterprise Value | 5,729 | |||||||||
| Net Debt | 235 | |||||||||
| Equity Value | 5,494 | |||||||||
| Diluted Shares Outstanding, MM | 51 | |||||||||
| Equity Value Per Share | 108.14 |
What You Will Get
- Real FOR Financials: Access to both historical and projected data for precise valuation.
- Customizable Inputs: Adjust WACC, tax rates, revenue growth, and capital expenditures to suit your analysis.
- Dynamic Calculations: Intrinsic value and NPV are automatically computed in real-time.
- Scenario Analysis: Evaluate multiple scenarios to assess Forestar Group Inc.'s future performance.
- User-Friendly Design: Designed for professionals while remaining easy to navigate for newcomers.
Key Features
- Comprehensive DCF Calculator: Features detailed unlevered and levered DCF valuation models tailored for Forestar Group Inc. (FOR).
- WACC Calculator: Pre-configured Weighted Average Cost of Capital sheet with adjustable inputs specific to Forestar Group Inc. (FOR).
- Customizable Forecast Assumptions: Adjust growth rates, capital expenditures, and discount rates to fit the needs of Forestar Group Inc. (FOR).
- Integrated Financial Ratios: Evaluate profitability, leverage, and efficiency ratios for Forestar Group Inc. (FOR).
- Visual Dashboard and Charts: Graphical representations summarize essential valuation metrics for straightforward analysis of Forestar Group Inc. (FOR).
How It Works
- Step 1: Download the prebuilt Excel template featuring Forestar Group Inc. (FOR) data.
- Step 2: Navigate through the pre-filled sheets to familiarize yourself with the essential metrics.
- Step 3: Adjust forecasts and assumptions in the editable yellow cells (WACC, growth, margins).
- Step 4: Instantly see the recalculated results, including Forestar Group Inc.'s (FOR) intrinsic value.
- Step 5: Make well-informed investment decisions or create reports based on the outputs.
Why Choose Forestar Group Inc. (FOR)?
- Streamlined Processes: Efficient operations that minimize time spent on project management.
- Enhanced Reliability: Proven track record in delivering quality residential and commercial developments.
- Tailored Solutions: Customized land development strategies to meet specific market needs.
- User-Friendly Interface: Intuitive tools and resources for easy access to information.
- Industry Expertise: Backed by a team of professionals dedicated to excellence in real estate.
Who Should Use Forestar Group Inc. (FOR)?
- Individual Investors: Gain insights to make informed decisions about investing in Forestar Group Inc. (FOR).
- Real Estate Analysts: Enhance property valuation processes with comprehensive data and models related to Forestar Group Inc. (FOR).
- Consultants: Provide clients with accurate and timely valuation insights on Forestar Group Inc. (FOR).
- Land Developers: Understand the valuation metrics of companies like Forestar Group Inc. (FOR) to inform your development strategies.
- Finance Students: Explore real-world valuation techniques using the data and scenarios associated with Forestar Group Inc. (FOR).
What the Template Contains
- Operating and Balance Sheet Data: Pre-filled Forestar Group Inc. (FOR) historical data and forecasts, including revenue, EBITDA, EBIT, and capital expenditures.
- WACC Calculation: A dedicated sheet for Weighted Average Cost of Capital (WACC), including parameters like Beta, risk-free rate, and share price.
- DCF Valuation (Unlevered and Levered): Editable Discounted Cash Flow models showing intrinsic value with detailed calculations.
- Financial Statements: Pre-loaded financial statements (annual and quarterly) to support analysis.
- Key Ratios: Includes profitability, leverage, and efficiency ratios for Forestar Group Inc. (FOR).
- Dashboard and Charts: Visual summary of valuation outputs and assumptions to analyze results easily.
Disclaimer
All information, articles, and product details provided on this website are for general informational and educational purposes only. We do not claim any ownership over, nor do we intend to infringe upon, any trademarks, copyrights, logos, brand names, or other intellectual property mentioned or depicted on this site. Such intellectual property remains the property of its respective owners, and any references here are made solely for identification or informational purposes, without implying any affiliation, endorsement, or partnership.
We make no representations or warranties, express or implied, regarding the accuracy, completeness, or suitability of any content or products presented. Nothing on this website should be construed as legal, tax, investment, financial, medical, or other professional advice. In addition, no part of this site—including articles or product references—constitutes a solicitation, recommendation, endorsement, advertisement, or offer to buy or sell any securities, franchises, or other financial instruments, particularly in jurisdictions where such activity would be unlawful.
All content is of a general nature and may not address the specific circumstances of any individual or entity. It is not a substitute for professional advice or services. Any actions you take based on the information provided here are strictly at your own risk. You accept full responsibility for any decisions or outcomes arising from your use of this website and agree to release us from any liability in connection with your use of, or reliance upon, the content or products found herein.