
|
Foresight Autonomous Holdings Ltd. (FRSX) Évaluation DCF |
Entièrement Modifiable: Adapté À Vos Besoins Dans Excel Ou Sheets
Conception Professionnelle: Modèles Fiables Et Conformes Aux Normes Du Secteur
Pré-Construits Pour Une Utilisation Rapide Et Efficace
Compatible MAC/PC, entièrement débloqué
Aucune Expertise N'Est Requise; Facile À Suivre
Foresight Autonomous Holdings Ltd. (FRSX) Bundle
Améliorez vos choix d'investissement avec la calculatrice DCF DCF Holdings Ltd. (FRSX) Foresight Autonomous Holdings Ltd. (FRSX)! Utilisez des données financières réelles, ajustez les projections et dépenses de croissance et observez les effets immédiats sur la valeur intrinsèque de Foresight Autonomous Holdings Ltd. (FRSX) lorsque vous apportez des modifications.
What You Will Get
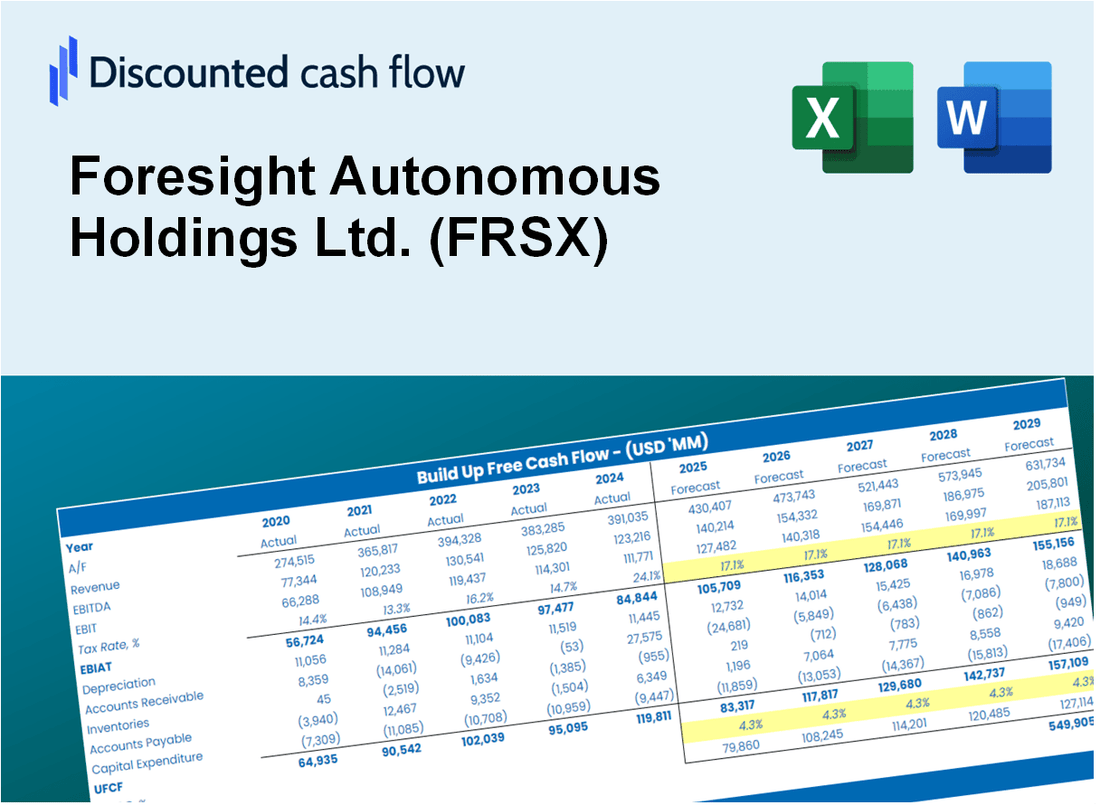
- Real Foresight Data: Preloaded financials – from revenue to EBIT – based on actual and projected figures for Foresight Autonomous Holdings Ltd. (FRSX).
- Full Customization: Adjust all critical parameters (yellow cells) like WACC, growth %, and tax rates specific to FRSX.
- Instant Valuation Updates: Automatic recalculations to analyze the impact of changes on Foresight’s fair value.
- Versatile Excel Template: Tailored for quick edits, scenario testing, and detailed projections for FRSX.
- Time-Saving and Accurate: Skip building models from scratch while maintaining precision and flexibility for Foresight Autonomous Holdings Ltd. (FRSX).
Key Features
- Comprehensive DCF Model: Offers detailed unlevered and levered DCF valuation frameworks tailored for Foresight Autonomous Holdings Ltd. (FRSX).
- WACC Analysis Tool: Pre-configured Weighted Average Cost of Capital calculator with adjustable parameters.
- Customizable Forecast Inputs: Adjust growth projections, capital investments, and discount rates as needed.
- Integrated Financial Metrics: Evaluate profitability, leverage, and operational efficiency ratios specific to Foresight Autonomous Holdings Ltd. (FRSX).
- Interactive Dashboard and Visuals: Graphical representations that distill essential valuation indicators for straightforward analysis.
How It Works
- Download: Obtain the pre-configured Excel file featuring Foresight Autonomous Holdings Ltd.'s (FRSX) financial data.
- Customize: Modify forecasts, including revenue growth, EBITDA %, and WACC to fit your analysis.
- Update Automatically: The intrinsic value and NPV calculations refresh in real-time as you make changes.
- Test Scenarios: Generate various projections and instantly compare the results.
- Make Decisions: Leverage the valuation outputs to inform your investment strategies.
Why Choose Foresight Autonomous Holdings Ltd. (FRSX)?
- Innovative Technology: Leverage cutting-edge solutions in autonomous driving and vehicle safety.
- Proven Expertise: Backed by a team of industry professionals with extensive experience.
- Custom Solutions: Tailored offerings to meet the specific needs of clients and partners.
- Data-Driven Insights: Utilize advanced analytics for informed decision-making and strategy development.
- Industry Recognition: A trusted name in the field, known for reliability and performance.
Who Should Use This Product?
- Professional Investors: Develop comprehensive and accurate valuation models for investment analysis in Foresight Autonomous Holdings Ltd. (FRSX).
- Corporate Finance Teams: Evaluate valuation scenarios to inform strategic decisions within the organization.
- Consultants and Advisors: Offer clients precise valuation insights for Foresight Autonomous Holdings Ltd. (FRSX) stock.
- Students and Educators: Utilize real-world data to enhance learning and practice in financial modeling.
- Tech Enthusiasts: Gain insight into how autonomous technology companies like Foresight Autonomous Holdings Ltd. (FRSX) are valued in the market.
What the Template Contains
- Preloaded FRSX Data: Historical and projected financial data, including revenue, EBIT, and capital expenditures.
- DCF and WACC Models: Professional-grade sheets for calculating intrinsic value and Weighted Average Cost of Capital.
- Editable Inputs: Yellow-highlighted cells for adjusting revenue growth, tax rates, and discount rates.
- Financial Statements: Comprehensive annual and quarterly financials for deeper analysis.
- Key Ratios: Profitability, leverage, and efficiency ratios to evaluate performance.
- Dashboard and Charts: Visual summaries of valuation outcomes and assumptions.
Disclaimer
All information, articles, and product details provided on this website are for general informational and educational purposes only. We do not claim any ownership over, nor do we intend to infringe upon, any trademarks, copyrights, logos, brand names, or other intellectual property mentioned or depicted on this site. Such intellectual property remains the property of its respective owners, and any references here are made solely for identification or informational purposes, without implying any affiliation, endorsement, or partnership.
We make no representations or warranties, express or implied, regarding the accuracy, completeness, or suitability of any content or products presented. Nothing on this website should be construed as legal, tax, investment, financial, medical, or other professional advice. In addition, no part of this site—including articles or product references—constitutes a solicitation, recommendation, endorsement, advertisement, or offer to buy or sell any securities, franchises, or other financial instruments, particularly in jurisdictions where such activity would be unlawful.
All content is of a general nature and may not address the specific circumstances of any individual or entity. It is not a substitute for professional advice or services. Any actions you take based on the information provided here are strictly at your own risk. You accept full responsibility for any decisions or outcomes arising from your use of this website and agree to release us from any liability in connection with your use of, or reliance upon, the content or products found herein.