
|
Ganesh Housing Corporation Limited (Ganeshhouc.NS) Évaluation DCF |
Entièrement Modifiable: Adapté À Vos Besoins Dans Excel Ou Sheets
Conception Professionnelle: Modèles Fiables Et Conformes Aux Normes Du Secteur
Pré-Construits Pour Une Utilisation Rapide Et Efficace
Compatible MAC/PC, entièrement débloqué
Aucune Expertise N'Est Requise; Facile À Suivre
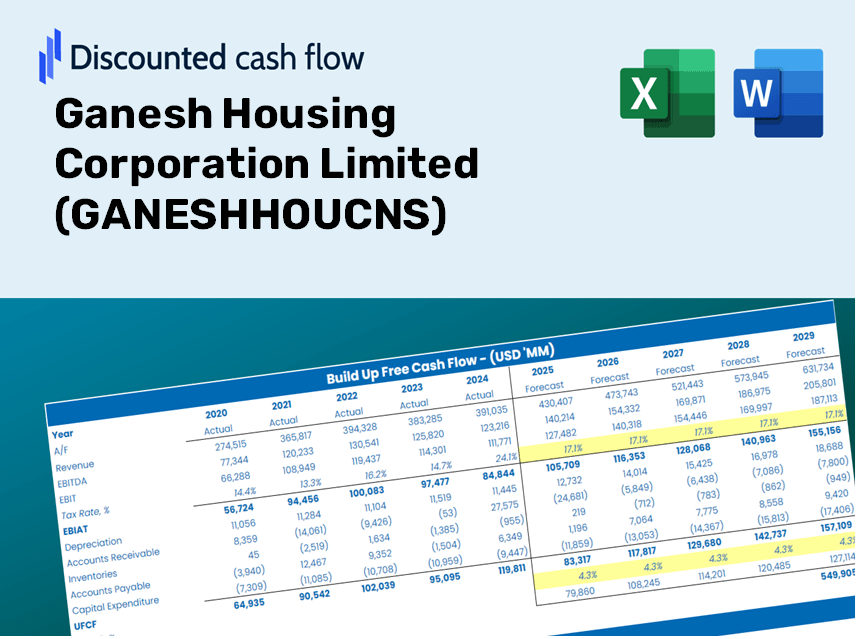
Ganesh Housing Corporation Limited (GANESHHOUC.NS) Bundle
Améliorez vos stratégies d'investissement avec la calculatrice DCF (Ganeshhoucns)! Explorez des données financières authentiques pour Ganesh Housing Corporation Limited, ajustez vos projections et dépenses de croissance et observez instantanément comment ces modifications affectent la valeur intrinsèque de (Ganeshhoucns).
What You Will Receive
- Authentic Ganesh Housing Data: Preloaded financials – covering metrics from revenue to EBIT – based on real and projected data.
- Complete Customization: Modify key parameters (yellow cells) such as WACC, growth %, and tax rates.
- Immediate Valuation Updates: Automatic recalculations to assess the impact of changes on Ganesh Housing's fair value.
- Flexible Excel Template: Designed for quick modifications, scenario analysis, and detailed forecasting.
- Efficient and Accurate: Eliminate the need to build models from scratch while ensuring accuracy and adaptability.
Key Features
- Comprehensive DCF Calculator: Offers detailed unlevered and levered DCF valuation frameworks.
- WACC Calculator: Pre-configured Weighted Average Cost of Capital tool with adjustable inputs.
- Customizable Forecast Assumptions: Alter growth projections, capital expenditures, and discount rates as needed.
- Integrated Financial Ratios: Evaluate profitability, leverage, and efficiency ratios specifically for Ganesh Housing Corporation Limited (GANESHHOUCNS).
- Visual Dashboard and Charts: Graphical representations highlight essential valuation metrics for straightforward analysis.
How It Functions
- Download: Get the pre-prepared Excel file containing Ganesh Housing Corporation Limited’s financial data.
- Customize: Modify forecasts, such as revenue growth, EBITDA percentage, and WACC.
- Update Automatically: Real-time updates for intrinsic value and NPV calculations.
- Test Scenarios: Generate various projections and analyze outcomes side-by-side.
- Make Decisions: Leverage the valuation results to inform your investment approach for GANESHHOUCNS.
Why Choose Ganesh Housing Corporation Limited (GANESHHOUCNS)?
- Time-Saving: Skip the hassle of building a model from the ground up – our tools are ready for immediate use.
- Enhanced Accuracy: Dependable financial data and calculations minimize valuation errors.
- Completely Customizable: Adjust the model to fit your specific assumptions and forecasts.
- User-Friendly: Intuitive charts and outputs ensure results are straightforward to understand.
- Endorsed by Professionals: Crafted for those who prioritize accuracy and functionality.
Who Can Benefit from This Product?
- Real Estate Investors: Develop accurate valuation models for property and portfolio assessments.
- Corporate Finance Teams: Explore valuation strategies to inform company growth and development.
- Consultants and Advisors: Equip clients with precise valuation insights for Ganesh Housing Corporation Limited (GANESHHOUCNS).
- Students and Educators: Utilize real estate data to enhance financial modeling skills and knowledge.
- Housing Market Enthusiasts: Gain insights into how companies like Ganesh Housing Corporation Limited (GANESHHOUCNS) are valued in the industry.
Contents of the Ganesh Housing Template
- Preloaded GANESHHOUCNS Data: Comprehensive historical and projected financial figures, including revenue, EBIT, and capital expenditures.
- DCF and WACC Models: Advanced spreadsheets designed for calculating intrinsic value and Weighted Average Cost of Capital.
- Editable Inputs: Cells highlighted in yellow for customizing revenue growth, tax rates, and discount rates.
- Financial Statements: Detailed annual and quarterly financial statements for in-depth analysis.
- Key Ratios: Metrics on profitability, leverage, and efficiency to assess corporate performance.
- Dashboard and Charts: Visual representations of valuation results and underlying assumptions.
Disclaimer
All information, articles, and product details provided on this website are for general informational and educational purposes only. We do not claim any ownership over, nor do we intend to infringe upon, any trademarks, copyrights, logos, brand names, or other intellectual property mentioned or depicted on this site. Such intellectual property remains the property of its respective owners, and any references here are made solely for identification or informational purposes, without implying any affiliation, endorsement, or partnership.
We make no representations or warranties, express or implied, regarding the accuracy, completeness, or suitability of any content or products presented. Nothing on this website should be construed as legal, tax, investment, financial, medical, or other professional advice. In addition, no part of this site—including articles or product references—constitutes a solicitation, recommendation, endorsement, advertisement, or offer to buy or sell any securities, franchises, or other financial instruments, particularly in jurisdictions where such activity would be unlawful.
All content is of a general nature and may not address the specific circumstances of any individual or entity. It is not a substitute for professional advice or services. Any actions you take based on the information provided here are strictly at your own risk. You accept full responsibility for any decisions or outcomes arising from your use of this website and agree to release us from any liability in connection with your use of, or reliance upon, the content or products found herein.