
|
Games Workshop Group Plc (GAW.L) Valation DCF |
Entièrement Modifiable: Adapté À Vos Besoins Dans Excel Ou Sheets
Conception Professionnelle: Modèles Fiables Et Conformes Aux Normes Du Secteur
Pré-Construits Pour Une Utilisation Rapide Et Efficace
Compatible MAC/PC, entièrement débloqué
Aucune Expertise N'Est Requise; Facile À Suivre
Games Workshop Group PLC (GAW.L) Bundle
Évaluez les perspectives financières de Games Workshop Group plc (GAWL) comme un professionnel! Cette calculatrice (GAWL) DCF fournit des données financières pré-remplies ainsi que la flexibilité pour modifier la croissance des revenus, le WACC, les marges et autres hypothèses essentielles pour s'aligner sur vos projections.
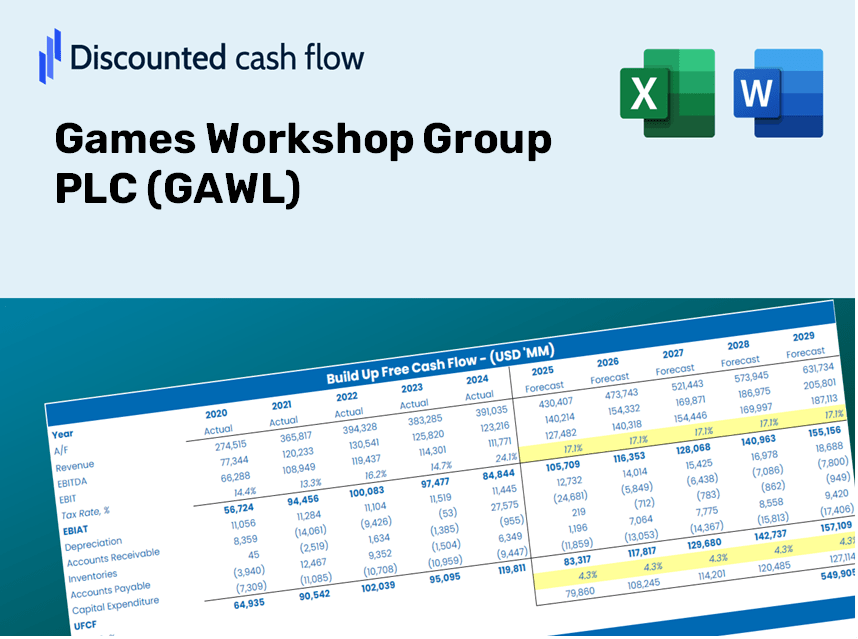
Discounted Cash Flow (DCF) - (USD MM)
| Year | AY1 2021 |
AY2 2022 |
AY3 2023 |
AY4 2024 |
AY5 2025 |
FY1 2026 |
FY2 2027 |
FY3 2028 |
FY4 2029 |
FY5 2030 |
|---|---|---|---|---|---|---|---|---|---|---|
| Revenue | 369.5 | 414.8 | 470.8 | 525.7 | 617.5 | 702.2 | 798.6 | 908.2 | 1,032.8 | 1,174.5 |
| Revenue Growth, % | 0 | 12.26 | 13.5 | 11.66 | 17.46 | 13.72 | 13.72 | 13.72 | 13.72 | 13.72 |
| EBITDA | 178.1 | 169.9 | 211.0 | 243.3 | 308.1 | 323.2 | 367.6 | 418.0 | 475.4 | 540.6 |
| EBITDA, % | 48.2 | 40.96 | 44.82 | 46.28 | 49.89 | 46.03 | 46.03 | 46.03 | 46.03 | 46.03 |
| Depreciation | 26.2 | 34.7 | 39.5 | 38.8 | 43.9 | 53.8 | 61.2 | 69.6 | 79.2 | 90.0 |
| Depreciation, % | 7.09 | 8.37 | 8.39 | 7.38 | 7.11 | 7.67 | 7.67 | 7.67 | 7.67 | 7.67 |
| EBIT | 151.9 | 135.2 | 171.5 | 204.5 | 264.2 | 269.4 | 306.4 | 348.4 | 396.2 | 450.6 |
| EBIT, % | 41.11 | 32.59 | 36.43 | 38.9 | 42.79 | 38.36 | 38.36 | 38.36 | 38.36 | 38.36 |
| Total Cash | 85.2 | 71.4 | 90.2 | 107.6 | 132.6 | 142.4 | 161.9 | 184.1 | 209.4 | 238.1 |
| Total Cash, percent | .0 | .0 | .0 | .0 | .0 | .0 | .0 | .0 | .0 | .0 |
| Account Receivables | 31.7 | 44.0 | 50.8 | 20.7 | 52.1 | 59.5 | 67.6 | 76.9 | 87.5 | 99.5 |
| Account Receivables, % | 8.58 | 10.61 | 10.79 | 3.94 | 8.44 | 8.47 | 8.47 | 8.47 | 8.47 | 8.47 |
| Inventories | 27.5 | 38.4 | 33.0 | 42.2 | 39.5 | 53.6 | 60.9 | 69.3 | 78.8 | 89.6 |
| Inventories, % | 7.44 | 9.26 | 7.01 | 8.03 | 6.4 | 7.63 | 7.63 | 7.63 | 7.63 | 7.63 |
| Accounts Payable | 12.1 | 9.5 | 9.5 | 12.5 | 13.3 | 17.0 | 19.3 | 22.0 | 25.0 | 28.5 |
| Accounts Payable, % | 3.27 | 2.29 | 2.02 | 2.38 | 2.15 | 2.42 | 2.42 | 2.42 | 2.42 | 2.42 |
| Capital Expenditure | -30.0 | -32.3 | -28.3 | -32.6 | -40.9 | -48.8 | -55.5 | -63.1 | -71.8 | -81.6 |
| Capital Expenditure, % | -8.12 | -7.79 | -6.01 | -6.2 | -6.62 | -6.95 | -6.95 | -6.95 | -6.95 | -6.95 |
| Tax Rate, % | 25.38 | 25.38 | 25.38 | 25.38 | 25.38 | 25.38 | 25.38 | 25.38 | 25.38 | 25.38 |
| EBITAT | 122.8 | 110.9 | 135.4 | 152.2 | 197.1 | 210.6 | 239.5 | 272.4 | 309.8 | 352.3 |
| Depreciation | ||||||||||
| Changes in Account Receivables | ||||||||||
| Changes in Inventories | ||||||||||
| Changes in Accounts Payable | ||||||||||
| Capital Expenditure | ||||||||||
| UFCF | 71.9 | 87.5 | 145.2 | 182.3 | 172.2 | 197.9 | 232.1 | 263.9 | 300.1 | 341.3 |
| WACC, % | 7.74 | 7.74 | 7.74 | 7.74 | 7.74 | 7.74 | 7.74 | 7.74 | 7.74 | 7.74 |
| PV UFCF | ||||||||||
| SUM PV UFCF | 1,052.5 | |||||||||
| Long Term Growth Rate, % | 2.00 | |||||||||
| Free cash flow (T + 1) | 348 | |||||||||
| Terminal Value | 6,063 | |||||||||
| Present Terminal Value | 4,176 | |||||||||
| Enterprise Value | 5,229 | |||||||||
| Net Debt | -87 | |||||||||
| Equity Value | 5,316 | |||||||||
| Diluted Shares Outstanding, MM | 33 | |||||||||
| Equity Value Per Share | 16,089.71 |
What You Will Receive
- Pre-Filled Financial Model: Games Workshop Group PLC's actual data facilitates precise DCF valuation.
- Comprehensive Forecast Control: Modify revenue growth, profit margins, discount rates, and other critical variables.
- Real-Time Calculations: Automatic updates allow you to view results immediately as adjustments are made.
- Professional-Grade Template: A polished Excel file crafted for high-quality valuation presentations.
- Customizable and Replicable: Designed for adaptability, enabling repeated use for in-depth forecasts.
Key Features
- Pre-Loaded Data: Historical financial statements and pre-filled forecasts for Games Workshop Group PLC (GAWL).
- Fully Adjustable Inputs: Customize WACC, tax rates, revenue growth, and EBITDA margins as needed.
- Instant Results: View the intrinsic value of Games Workshop Group PLC (GAWL) recalculating in real time.
- Clear Visual Outputs: Dashboard charts provide clear displays of valuation results and essential metrics.
- Built for Accuracy: A professional-grade tool designed for analysts, investors, and finance professionals.
How It Operates
- Download: Obtain the pre-configured Excel file featuring Games Workshop Group PLC's (GAWL) financial data.
- Customize: Modify projections such as revenue growth, EBITDA %, and WACC to suit your analysis.
- Update Automatically: Enjoy real-time updates for intrinsic value and NPV calculations.
- Test Scenarios: Generate various forecasts and instantly compare their outcomes.
- Make Decisions: Leverage the valuation insights to inform your investment strategies.
Why Choose the Games Workshop Calculator?
- Save Time: Skip the hassle of building a DCF model from the ground up – our tool is ready for immediate use.
- Enhance Accuracy: Dependable financial data and formulas minimize valuation errors.
- Completely Customizable: Adjust the model to align with your specific assumptions and forecasts.
- User-Friendly: Intuitive charts and outputs streamline the analysis process.
- Endorsed by Professionals: Crafted for experts who prioritize precision and ease of use.
Who Should Benefit from This Product?
- Individual Investors: Make informed decisions regarding buying or selling Games Workshop Group PLC (GAWL) shares.
- Financial Analysts: Enhance valuation processes with readily available financial models tailored for Games Workshop Group PLC (GAWL).
- Consultants: Provide accurate and professional valuation insights for clients focused on Games Workshop Group PLC (GAWL).
- Business Owners: Gain insights into how companies like Games Workshop Group PLC (GAWL) are valued to inform your own strategic decisions.
- Finance Students: Develop valuation skills using real-world data and case studies centered around Games Workshop Group PLC (GAWL).
Contents of the Template
- Pre-Filled Data: Contains historical financials and forecasts for Games Workshop Group PLC (GAWL).
- Discounted Cash Flow Model: An editable DCF valuation model equipped with automatic calculations.
- Weighted Average Cost of Capital (WACC): A specialized sheet for computing WACC using customized inputs.
- Key Financial Ratios: Evaluate the profitability, efficiency, and leverage of Games Workshop Group PLC (GAWL).
- Customizable Inputs: Easily adjust revenue growth, margins, and tax rates.
- Clear Dashboard: Visual charts and tables summarizing essential valuation results.
Disclaimer
All information, articles, and product details provided on this website are for general informational and educational purposes only. We do not claim any ownership over, nor do we intend to infringe upon, any trademarks, copyrights, logos, brand names, or other intellectual property mentioned or depicted on this site. Such intellectual property remains the property of its respective owners, and any references here are made solely for identification or informational purposes, without implying any affiliation, endorsement, or partnership.
We make no representations or warranties, express or implied, regarding the accuracy, completeness, or suitability of any content or products presented. Nothing on this website should be construed as legal, tax, investment, financial, medical, or other professional advice. In addition, no part of this site—including articles or product references—constitutes a solicitation, recommendation, endorsement, advertisement, or offer to buy or sell any securities, franchises, or other financial instruments, particularly in jurisdictions where such activity would be unlawful.
All content is of a general nature and may not address the specific circumstances of any individual or entity. It is not a substitute for professional advice or services. Any actions you take based on the information provided here are strictly at your own risk. You accept full responsibility for any decisions or outcomes arising from your use of this website and agree to release us from any liability in connection with your use of, or reliance upon, the content or products found herein.