
|
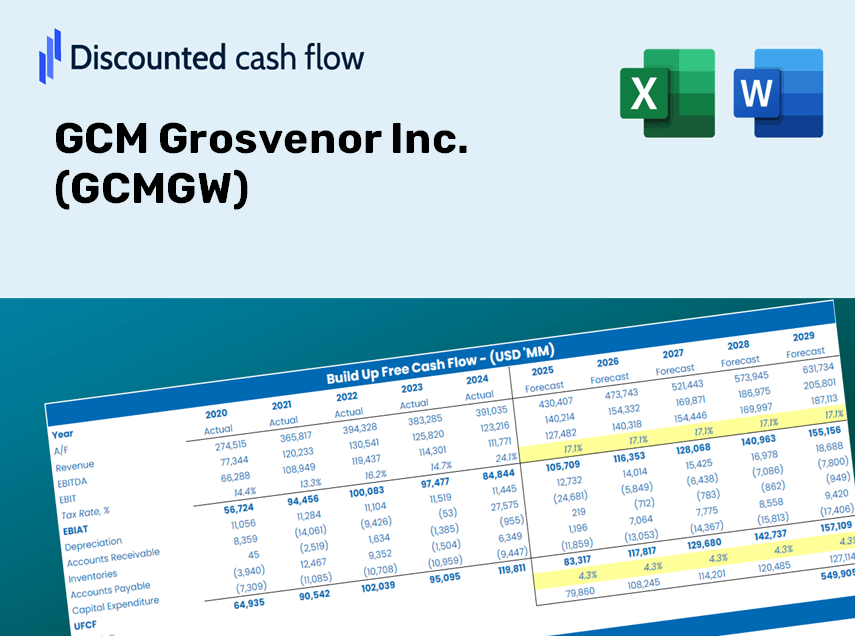
GCM Grosvenor Inc. (GCMGW) Évaluation DCF |
Entièrement Modifiable: Adapté À Vos Besoins Dans Excel Ou Sheets
Conception Professionnelle: Modèles Fiables Et Conformes Aux Normes Du Secteur
Pré-Construits Pour Une Utilisation Rapide Et Efficace
Compatible MAC/PC, entièrement débloqué
Aucune Expertise N'Est Requise; Facile À Suivre
GCM Grosvenor Inc. (GCMGW) Bundle
Améliorez vos stratégies d'investissement avec la calculatrice DCF GCM Grosvenor Inc. (GCMGW)! Explorez des données financières authentiques, ajustez les prévisions et les dépenses de croissance et visualisez instantanément comment ces changements affectent la valeur intrinsèque de GCM Grosvenor Inc. (GCMGW).
Discounted Cash Flow (DCF) - (USD MM)
| Year | AY1 2020 |
AY2 2021 |
AY3 2022 |
AY4 2023 |
AY5 2024 |
FY1 2025 |
FY2 2026 |
FY3 2027 |
FY4 2028 |
FY5 2029 |
|---|---|---|---|---|---|---|---|---|---|---|
| Revenue | 433.1 | 531.6 | 446.5 | 445.0 | 514.0 | 542.1 | 571.8 | 603.1 | 636.1 | 671.0 |
| Revenue Growth, % | 0 | 22.73 | -16 | -0.34287 | 15.51 | 5.47 | 5.47 | 5.47 | 5.47 | 5.47 |
| EBITDA | -51.0 | 130.2 | 84.2 | -9.2 | 77.6 | 48.4 | 51.0 | 53.8 | 56.8 | 59.9 |
| EBITDA, % | -11.76 | 24.49 | 18.85 | -2.06 | 15.11 | 8.93 | 8.93 | 8.93 | 8.93 | 8.93 |
| Depreciation | 9.8 | 4.0 | 3.9 | 2.7 | 3.3 | 5.6 | 5.9 | 6.2 | 6.5 | 6.9 |
| Depreciation, % | 2.27 | 0.75622 | 0.86355 | 0.60584 | 0.6459 | 1.03 | 1.03 | 1.03 | 1.03 | 1.03 |
| EBIT | -60.8 | 126.2 | 80.3 | -11.8 | 74.3 | 42.8 | 45.2 | 47.6 | 50.2 | 53.0 |
| EBIT, % | -14.03 | 23.74 | 17.99 | -2.66 | 14.46 | 7.9 | 7.9 | 7.9 | 7.9 | 7.9 |
| Total Cash | 198.1 | 96.2 | 85.2 | 44.4 | 89.5 | 119.6 | 126.1 | 133.0 | 140.3 | 148.0 |
| Total Cash, percent | .0 | .0 | .0 | .0 | .0 | .0 | .0 | .0 | .0 | .0 |
| Account Receivables | 95.3 | 125.1 | 48.3 | 65.9 | 99.4 | 98.1 | 103.5 | 109.2 | 115.1 | 121.5 |
| Account Receivables, % | 22 | 23.53 | 10.82 | 14.82 | 19.34 | 18.1 | 18.1 | 18.1 | 18.1 | 18.1 |
| Inventories | .0 | .0 | .0 | .0 | .0 | .0 | .0 | .0 | .0 | .0 |
| Inventories, % | 0 | 0 | 0 | 0 | 0 | 0 | 0 | 0 | 0 | 0 |
| Accounts Payable | .0 | .0 | .0 | .0 | .0 | .0 | .0 | .0 | .0 | .0 |
| Accounts Payable, % | 0 | 0 | 0 | 0 | 0 | 0 | 0 | 0 | 0 | 0 |
| Capital Expenditure | -1.3 | -.6 | -.8 | -3.8 | -16.7 | -5.1 | -5.4 | -5.7 | -6.0 | -6.3 |
| Capital Expenditure, % | -0.30198 | -0.10854 | -0.17513 | -0.84562 | -3.25 | -0.93717 | -0.93717 | -0.93717 | -0.93717 | -0.93717 |
| Tax Rate, % | 62.73 | 62.73 | 62.73 | 62.73 | 62.73 | 62.73 | 62.73 | 62.73 | 62.73 | 62.73 |
| EBITAT | 3.1 | 17.7 | 17.9 | 7.0 | 27.7 | 6.3 | 6.6 | 7.0 | 7.4 | 7.8 |
| Depreciation | ||||||||||
| Changes in Account Receivables | ||||||||||
| Changes in Inventories | ||||||||||
| Changes in Accounts Payable | ||||||||||
| Capital Expenditure | ||||||||||
| UFCF | -83.6 | -8.6 | 97.7 | -11.7 | -19.2 | 8.1 | 1.8 | 1.9 | 2.0 | 2.1 |
| WACC, % | 6.01 | 6.13 | 6.21 | 6.01 | 6.34 | 6.14 | 6.14 | 6.14 | 6.14 | 6.14 |
| PV UFCF | ||||||||||
| SUM PV UFCF | 13.9 | |||||||||
| Long Term Growth Rate, % | 2.00 | |||||||||
| Free cash flow (T + 1) | 2 | |||||||||
| Terminal Value | 52 | |||||||||
| Present Terminal Value | 38 | |||||||||
| Enterprise Value | 52 | |||||||||
| Net Debt | 396 | |||||||||
| Equity Value | -344 | |||||||||
| Diluted Shares Outstanding, MM | 191 | |||||||||
| Equity Value Per Share | -1.81 |
What You Will Receive
- Authentic GCM Data: Preloaded financial information – covering everything from revenue to EBIT – utilizing real and projected figures.
- Comprehensive Customization: Modify all key parameters (yellow cells) such as WACC, growth percentages, and tax rates.
- Immediate Valuation Updates: Automatic recalibrations to assess how changes affect GCM's fair value.
- Flexible Excel Template: Designed for easy adjustments, scenario explorations, and in-depth forecasting.
- Efficient and Precise: Avoid the hassle of building models from the ground up while ensuring accuracy and adaptability.
Key Features
- 🔍 Real-Time GCM Financials: Pre-loaded historical and forecast data for GCM Grosvenor Inc. (GCMGW).
- ✏️ Fully Customizable Inputs: Modify essential parameters (yellow cells) such as WACC, growth %, and tax rates.
- 📊 Comprehensive DCF Valuation: Integrated formulas assess GCM’s intrinsic value using the Discounted Cash Flow method.
- ⚡ Immediate Insights: Visualize GCM’s valuation right away after making adjustments.
- Scenario Analysis: Evaluate and compare different outcomes based on various financial assumptions side-by-side.
How It Functions
- Download: Obtain the pre-built Excel file featuring GCM Grosvenor Inc.'s (GCMGW) financial data.
- Customize: Tailor forecasts, such as revenue growth, EBITDA %, and WACC to your needs.
- Update Automatically: Watch as the intrinsic value and NPV calculations refresh in real-time.
- Test Scenarios: Generate various projections and instantly analyze different outcomes.
- Make Decisions: Leverage the valuation findings to inform your investment approach.
Why Opt for GCM Grosvenor's Calculator?
- All-in-One Tool: Features DCF, WACC, and comprehensive financial ratio analyses in a single platform.
- Flexible Inputs: Modify the highlighted cells to explore different financial scenarios.
- In-Depth Analysis: Automatically computes GCM Grosvenor’s intrinsic value and Net Present Value.
- Data Ready: Comes with historical and projected data for precise calculations.
- High-Quality Standard: Perfect for financial analysts, investors, and business consultants.
Who Can Benefit from GCM Grosvenor Inc. ([GCMGW])?
- Investors: Equip yourself with a cutting-edge valuation tool to make informed investment choices.
- Financial Analysts: Streamline your workflow with a customizable DCF model designed for efficiency.
- Consultants: Effortlessly modify the template for impactful client presentations and reports.
- Finance Enthusiasts: Enhance your grasp of valuation methods through practical, real-world illustrations.
- Educators and Students: Leverage this tool as a hands-on resource for finance education and training.
Contents of the Template
- Historical Data: Contains GCM Grosvenor Inc.’s (GCMGW) previous financial records and foundational forecasts.
- DCF and Levered DCF Models: Comprehensive templates for determining the intrinsic value of GCM Grosvenor Inc. (GCMGW).
- WACC Sheet: Pre-calculated metrics for Weighted Average Cost of Capital.
- Editable Inputs: Customize key factors such as growth rates, EBITDA percentages, and CAPEX projections.
- Quarterly and Annual Statements: An extensive analysis of GCM Grosvenor Inc.’s (GCMGW) financial performance.
- Interactive Dashboard: Tools to dynamically visualize valuation outcomes and future forecasts.
Disclaimer
All information, articles, and product details provided on this website are for general informational and educational purposes only. We do not claim any ownership over, nor do we intend to infringe upon, any trademarks, copyrights, logos, brand names, or other intellectual property mentioned or depicted on this site. Such intellectual property remains the property of its respective owners, and any references here are made solely for identification or informational purposes, without implying any affiliation, endorsement, or partnership.
We make no representations or warranties, express or implied, regarding the accuracy, completeness, or suitability of any content or products presented. Nothing on this website should be construed as legal, tax, investment, financial, medical, or other professional advice. In addition, no part of this site—including articles or product references—constitutes a solicitation, recommendation, endorsement, advertisement, or offer to buy or sell any securities, franchises, or other financial instruments, particularly in jurisdictions where such activity would be unlawful.
All content is of a general nature and may not address the specific circumstances of any individual or entity. It is not a substitute for professional advice or services. Any actions you take based on the information provided here are strictly at your own risk. You accept full responsibility for any decisions or outcomes arising from your use of this website and agree to release us from any liability in connection with your use of, or reliance upon, the content or products found herein.