
|
Global Net Lease, Inc. (GNL) Évaluation DCF |
Entièrement Modifiable: Adapté À Vos Besoins Dans Excel Ou Sheets
Conception Professionnelle: Modèles Fiables Et Conformes Aux Normes Du Secteur
Pré-Construits Pour Une Utilisation Rapide Et Efficace
Compatible MAC/PC, entièrement débloqué
Aucune Expertise N'Est Requise; Facile À Suivre
Global Net Lease, Inc. (GNL) Bundle
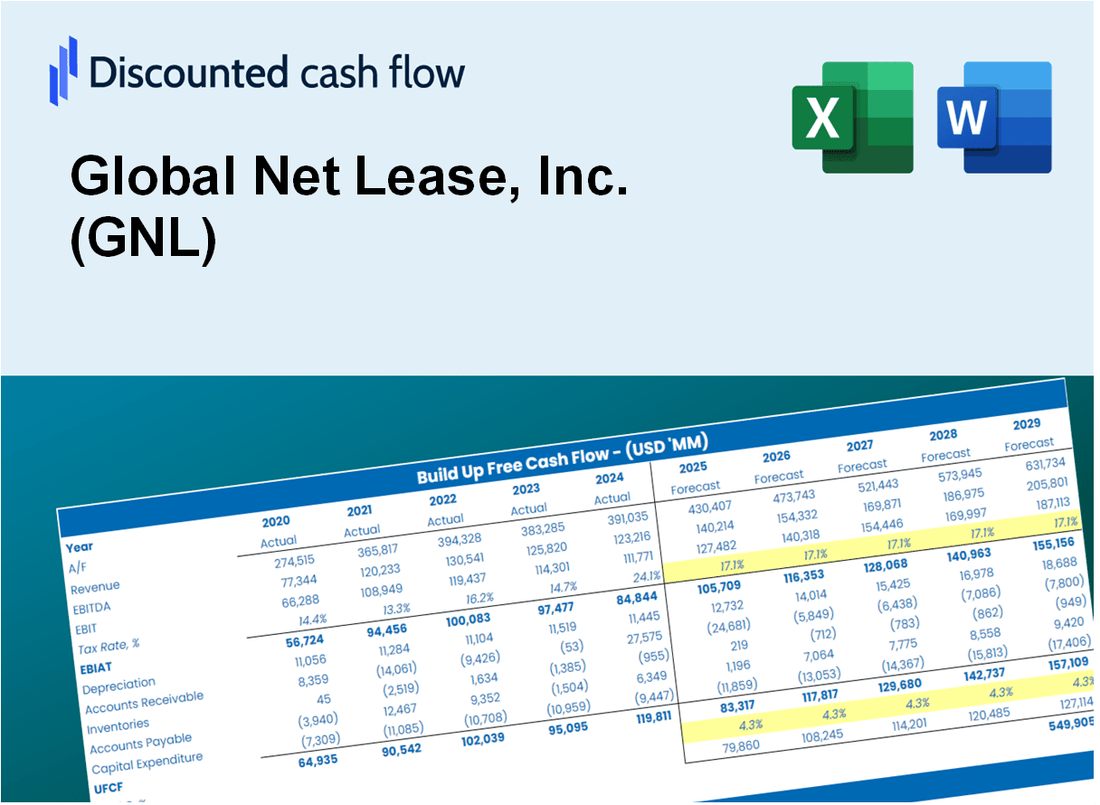
Rationalisez votre analyse et améliorez la précision avec notre calculatrice DCF (GNL)! Équipée de données réelles de Global Net Lease, Inc. et d'hypothèses personnalisables, cet outil vous permet de prévoir, analyser et valoriser (GNL) tout comme un investisseur chevronné.
Discounted Cash Flow (DCF) - (USD MM)
| Year | AY1 2020 |
AY2 2021 |
AY3 2022 |
AY4 2023 |
AY5 2024 |
FY1 2025 |
FY2 2026 |
FY3 2027 |
FY4 2028 |
FY5 2029 |
|---|---|---|---|---|---|---|---|---|---|---|
| Revenue | 330.1 | 391.2 | 378.9 | 515.1 | 805.0 | 1,021.6 | 1,296.4 | 1,645.1 | 2,087.6 | 2,649.2 |
| Revenue Growth, % | 0 | 18.52 | -3.16 | 35.95 | 56.29 | 26.9 | 26.9 | 26.9 | 26.9 | 26.9 |
| EBITDA | 230.3 | 285.5 | 279.4 | 215.7 | 568.9 | 672.3 | 853.2 | 1,082.7 | 1,373.9 | 1,743.5 |
| EBITDA, % | 69.77 | 72.99 | 73.75 | 41.88 | 70.67 | 65.81 | 65.81 | 65.81 | 65.81 | 65.81 |
| Depreciation | 142.8 | 167.7 | 158.9 | 233.7 | 369.1 | 448.0 | 568.5 | 721.4 | 915.5 | 1,161.8 |
| Depreciation, % | 43.25 | 42.86 | 41.93 | 45.38 | 45.85 | 43.85 | 43.85 | 43.85 | 43.85 | 43.85 |
| EBIT | 87.6 | 117.9 | 120.6 | -18.0 | 199.8 | 224.3 | 284.7 | 361.2 | 458.4 | 581.7 |
| EBIT, % | 26.52 | 30.13 | 31.82 | -3.5 | 24.82 | 21.96 | 21.96 | 21.96 | 21.96 | 21.96 |
| Total Cash | 124.2 | 89.7 | 103.3 | 121.6 | 159.7 | 268.2 | 340.4 | 431.9 | 548.1 | 695.5 |
| Total Cash, percent | .0 | .0 | .0 | .0 | .0 | .0 | .0 | .0 | .0 | .0 |
| Account Receivables | .4 | 74.2 | 73.0 | 84.3 | 99.5 | 137.1 | 173.9 | 220.7 | 280.1 | 355.4 |
| Account Receivables, % | 0.11421 | 18.97 | 19.28 | 16.36 | 12.36 | 13.42 | 13.42 | 13.42 | 13.42 | 13.42 |
| Inventories | .0 | -1.2 | .0 | .0 | .0 | -.6 | -.8 | -1.0 | -1.3 | -1.6 |
| Inventories, % | 0 | -0.31082 | 0 | 0 | 0 | -0.06216324 | -0.06216324 | -0.06216324 | -0.06216324 | -0.06216324 |
| Accounts Payable | 28.3 | 25.9 | 22.9 | 99.0 | 75.7 | 101.9 | 129.3 | 164.1 | 208.2 | 264.2 |
| Accounts Payable, % | 8.58 | 6.62 | 6.04 | 19.22 | 9.41 | 9.97 | 9.97 | 9.97 | 9.97 | 9.97 |
| Capital Expenditure | -6.4 | -7.9 | -29.9 | -47.3 | -45.6 | -54.6 | -69.3 | -87.9 | -111.5 | -141.5 |
| Capital Expenditure, % | -1.93 | -2.03 | -7.9 | -9.18 | -5.67 | -5.34 | -5.34 | -5.34 | -5.34 | -5.34 |
| Tax Rate, % | -3.5 | -3.5 | -3.5 | -3.5 | -3.5 | -3.5 | -3.5 | -3.5 | -3.5 | -3.5 |
| EBITAT | 59.9 | 57.0 | 62.9 | -19.3 | 206.8 | 165.5 | 210.0 | 266.5 | 338.2 | 429.2 |
| Depreciation | ||||||||||
| Changes in Account Receivables | ||||||||||
| Changes in Inventories | ||||||||||
| Changes in Accounts Payable | ||||||||||
| Capital Expenditure | ||||||||||
| UFCF | 224.3 | 141.7 | 188.8 | 232.0 | 491.7 | 548.2 | 700.0 | 888.3 | 1,127.2 | 1,430.5 |
| WACC, % | 6.02 | 5 | 5.19 | 7.61 | 7.61 | 6.29 | 6.29 | 6.29 | 6.29 | 6.29 |
| PV UFCF | ||||||||||
| SUM PV UFCF | 3,813.1 | |||||||||
| Long Term Growth Rate, % | 2.00 | |||||||||
| Free cash flow (T + 1) | 1,459 | |||||||||
| Terminal Value | 34,041 | |||||||||
| Present Terminal Value | 25,097 | |||||||||
| Enterprise Value | 28,910 | |||||||||
| Net Debt | 4,484 | |||||||||
| Equity Value | 24,427 | |||||||||
| Diluted Shares Outstanding, MM | 230 | |||||||||
| Equity Value Per Share | 106.00 |
What You Will Get
- Editable Excel Template: A fully customizable Excel-based DCF Calculator featuring pre-filled real GNL financials.
- Real-World Data: Historical data and forward-looking estimates (as indicated in the yellow cells).
- Forecast Flexibility: Adjust forecast assumptions such as revenue growth, EBITDA %, and WACC.
- Automatic Calculations: Instantly observe the effects of your inputs on Global Net Lease, Inc.'s valuation.
- Professional Tool: Designed for investors, CFOs, consultants, and financial analysts.
- User-Friendly Design: Organized for clarity and ease of use, complete with step-by-step instructions.
Key Features
- Comprehensive Financial Data: Global Net Lease, Inc. (GNL) provides extensive historical financial statements and detailed forecasts.
- Customizable Parameters: Adjust inputs such as WACC, tax rates, revenue growth, and EBITDA margins to fit your analysis.
- Real-Time Valuation: Instantly view the recalculated intrinsic value of Global Net Lease, Inc. (GNL).
- Intuitive Visualizations: Engaging dashboard charts illustrate valuation outcomes and essential metrics.
- Designed for Precision: A reliable resource tailored for analysts, investors, and finance professionals.
How It Works
- 1. Access the Template: Download and open the Excel file containing Global Net Lease, Inc.'s (GNL) preloaded data.
- 2. Modify Assumptions: Adjust key inputs such as growth rates, WACC, and capital expenditures to fit your analysis.
- 3. View Results Instantly: The DCF model automatically calculates the intrinsic value and NPV based on your inputs.
- 4. Explore Scenarios: Analyze various forecasts to evaluate different valuation possibilities.
- 5. Present with Confidence: Deliver professional valuation insights to enhance your decision-making process.
Why Choose Global Net Lease, Inc. (GNL)?
- Maximize Returns: Benefit from a well-structured investment strategy tailored for real estate.
- Enhance Portfolio Diversification: Invest in a diverse range of properties across various sectors.
- Transparent Operations: Access clear and comprehensive reports for informed decision-making.
- Expert Management: Rely on a team of seasoned professionals dedicated to optimizing performance.
- Proven Track Record: Join a company with a history of delivering consistent returns to investors.
Who Should Use Global Net Lease, Inc. (GNL)?
- Real Estate Investors: Gain insights for informed decisions with a reliable investment analysis tool.
- Portfolio Managers: Streamline your workflow with a customizable financial model tailored for REITs.
- Financial Advisors: Easily modify the template for client portfolios or investment strategies.
- Market Analysts: Enhance your understanding of real estate investment trusts through practical case studies.
- Students and Educators: Utilize it as a hands-on resource in real estate finance courses.
What the Template Contains
- Comprehensive DCF Model: Editable template featuring in-depth valuation calculations.
- Real-World Data: Global Net Lease, Inc.'s (GNL) historical and projected financials preloaded for analysis.
- Customizable Parameters: Modify WACC, growth rates, and tax assumptions to explore various scenarios.
- Financial Statements: Complete annual and quarterly breakdowns for enhanced insights.
- Key Ratios: Integrated analysis for profitability, efficiency, and leverage metrics.
- Dashboard with Visual Outputs: Charts and tables designed for clear, actionable insights.
Disclaimer
All information, articles, and product details provided on this website are for general informational and educational purposes only. We do not claim any ownership over, nor do we intend to infringe upon, any trademarks, copyrights, logos, brand names, or other intellectual property mentioned or depicted on this site. Such intellectual property remains the property of its respective owners, and any references here are made solely for identification or informational purposes, without implying any affiliation, endorsement, or partnership.
We make no representations or warranties, express or implied, regarding the accuracy, completeness, or suitability of any content or products presented. Nothing on this website should be construed as legal, tax, investment, financial, medical, or other professional advice. In addition, no part of this site—including articles or product references—constitutes a solicitation, recommendation, endorsement, advertisement, or offer to buy or sell any securities, franchises, or other financial instruments, particularly in jurisdictions where such activity would be unlawful.
All content is of a general nature and may not address the specific circumstances of any individual or entity. It is not a substitute for professional advice or services. Any actions you take based on the information provided here are strictly at your own risk. You accept full responsibility for any decisions or outcomes arising from your use of this website and agree to release us from any liability in connection with your use of, or reliance upon, the content or products found herein.