
|
Garantie Bancshares, Inc. (GNTY) Évaluation DCF |
Entièrement Modifiable: Adapté À Vos Besoins Dans Excel Ou Sheets
Conception Professionnelle: Modèles Fiables Et Conformes Aux Normes Du Secteur
Pré-Construits Pour Une Utilisation Rapide Et Efficace
Compatible MAC/PC, entièrement débloqué
Aucune Expertise N'Est Requise; Facile À Suivre
Guaranty Bancshares, Inc. (GNTY) Bundle
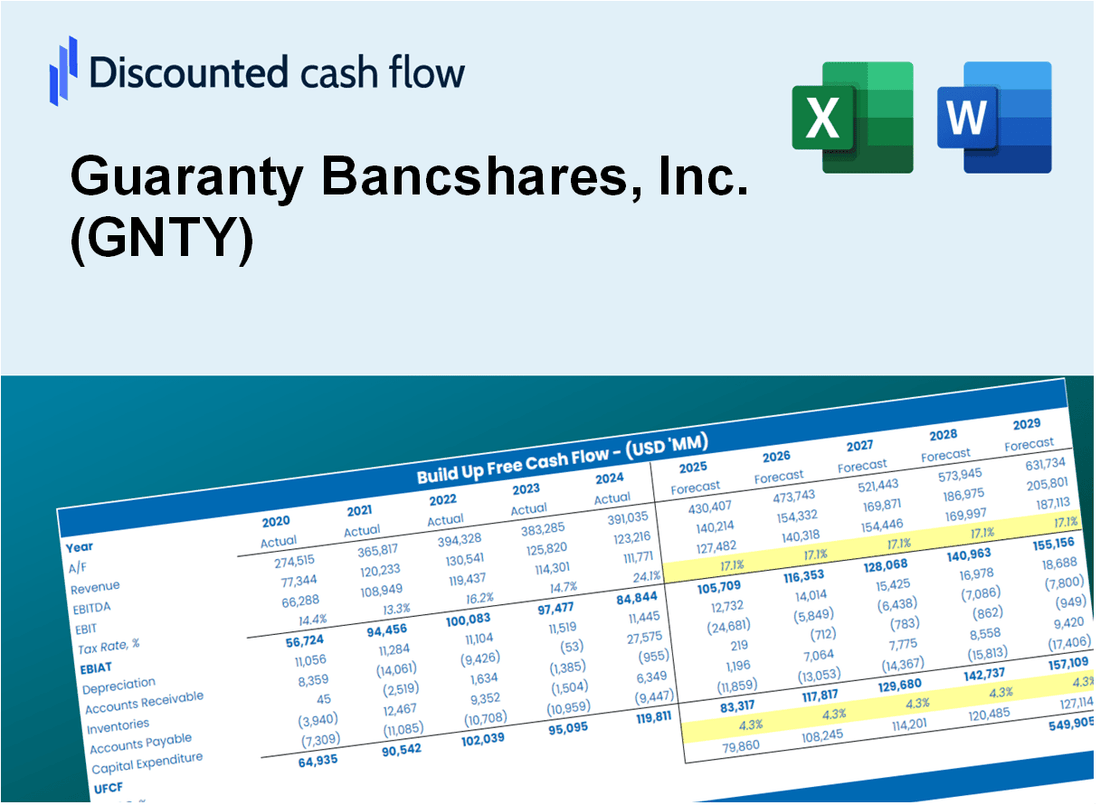
Explorez le potentiel financier de Guaranty Bancshares, Inc. (GNTY) avec notre calculatrice DCF conviviale! Entrez vos projections pour la croissance, les marges bénéficiaires et les dépenses pour déterminer la valeur intrinsèque de Guaranty Bancshares, Inc. (GNTY) et améliorez votre stratégie d'investissement.
What You Will Receive
- Customizable Excel Template: A fully adjustable Excel-based DCF Calculator featuring pre-filled financial data for Guaranty Bancshares, Inc. (GNTY).
- Real-Time Data: Access to historical performance data and forward-looking projections (highlighted in the yellow cells).
- Dynamic Forecast Options: Modify key assumptions such as revenue growth, EBITDA %, and WACC to suit your analysis.
- Instant Calculations: Observe real-time effects of your inputs on the valuation of Guaranty Bancshares, Inc. (GNTY).
- Professional Resource: Designed for investors, CFOs, consultants, and financial analysts seeking in-depth analysis.
- Intuitive Layout: Organized for simplicity and user-friendliness, complete with step-by-step guidance.
Key Features
- Comprehensive DCF Calculator: Offers detailed unlevered and levered DCF valuation models tailored for Guaranty Bancshares, Inc. (GNTY).
- WACC Calculator: Features a pre-built Weighted Average Cost of Capital sheet with adjustable inputs specific to the banking sector.
- Customizable Forecast Assumptions: Easily modify growth rates, capital expenditures, and discount rates to fit GNTY's financial outlook.
- Integrated Financial Ratios: Evaluate profitability, leverage, and efficiency ratios pertinent to Guaranty Bancshares, Inc. (GNTY).
- Interactive Dashboard and Charts: Visual representations summarize essential valuation metrics for straightforward analysis.
How It Works
- Step 1: Download the Excel file.
- Step 2: Review pre-entered Guaranty Bancshares, Inc. (GNTY) data (historical and projected).
- Step 3: Adjust key assumptions (yellow cells) based on your analysis.
- Step 4: View automatic recalculations for Guaranty Bancshares, Inc. (GNTY)’s intrinsic value.
- Step 5: Use the outputs for investment decisions or reporting.
Why Choose Guaranty Bancshares, Inc. (GNTY)?
- Comprehensive Services: Offers a wide range of banking solutions, from personal to commercial services.
- Tailored Solutions: Customizable financial products designed to meet the unique needs of each client.
- In-Depth Analysis: Provides detailed financial insights to help clients make informed decisions.
- Reliable Data: Access to up-to-date market information and historical performance metrics.
- Expert Support: Dedicated team of financial professionals ready to assist clients at every step.
Who Should Use This Product?
- Investors: Assess Guaranty Bancshares, Inc.'s (GNTY) valuation before making investment decisions.
- CFOs and Financial Analysts: Optimize valuation workflows and evaluate financial forecasts.
- Startup Founders: Understand the valuation methods applied to financial institutions like Guaranty Bancshares, Inc. (GNTY).
- Consultants: Provide detailed valuation analyses for your clients in the banking sector.
- Students and Educators: Utilize real-time data to learn and teach valuation strategies in finance.
What the GNTY Template Contains
- Comprehensive DCF Model: Editable template featuring detailed valuation calculations tailored for Guaranty Bancshares, Inc. (GNTY).
- Real-World Data: Guaranty Bancshares’ historical and projected financials preloaded for in-depth analysis.
- Customizable Parameters: Modify WACC, growth rates, and tax assumptions to explore various scenarios.
- Financial Statements: Complete annual and quarterly breakdowns for enhanced insights into performance.
- Key Ratios: Integrated analysis for assessing profitability, efficiency, and leverage metrics.
- Dashboard with Visual Outputs: Engaging charts and tables to present clear, actionable results.
Disclaimer
All information, articles, and product details provided on this website are for general informational and educational purposes only. We do not claim any ownership over, nor do we intend to infringe upon, any trademarks, copyrights, logos, brand names, or other intellectual property mentioned or depicted on this site. Such intellectual property remains the property of its respective owners, and any references here are made solely for identification or informational purposes, without implying any affiliation, endorsement, or partnership.
We make no representations or warranties, express or implied, regarding the accuracy, completeness, or suitability of any content or products presented. Nothing on this website should be construed as legal, tax, investment, financial, medical, or other professional advice. In addition, no part of this site—including articles or product references—constitutes a solicitation, recommendation, endorsement, advertisement, or offer to buy or sell any securities, franchises, or other financial instruments, particularly in jurisdictions where such activity would be unlawful.
All content is of a general nature and may not address the specific circumstances of any individual or entity. It is not a substitute for professional advice or services. Any actions you take based on the information provided here are strictly at your own risk. You accept full responsibility for any decisions or outcomes arising from your use of this website and agree to release us from any liability in connection with your use of, or reliance upon, the content or products found herein.