
|
Group 1 Automotive, Inc. (GPI) Valation DCF |
Entièrement Modifiable: Adapté À Vos Besoins Dans Excel Ou Sheets
Conception Professionnelle: Modèles Fiables Et Conformes Aux Normes Du Secteur
Pré-Construits Pour Une Utilisation Rapide Et Efficace
Compatible MAC/PC, entièrement débloqué
Aucune Expertise N'Est Requise; Facile À Suivre
Group 1 Automotive, Inc. (GPI) Bundle
Explorez les perspectives financières de Group 1 Automotive, Inc. (GPI) avec notre calculatrice DCF conviviale! Entrez vos hypothèses concernant la croissance, les marges et les dépenses pour calculer la valeur intrinsèque de Group 1 Automotive, Inc. (GPI) et améliorez vos décisions d'investissement.
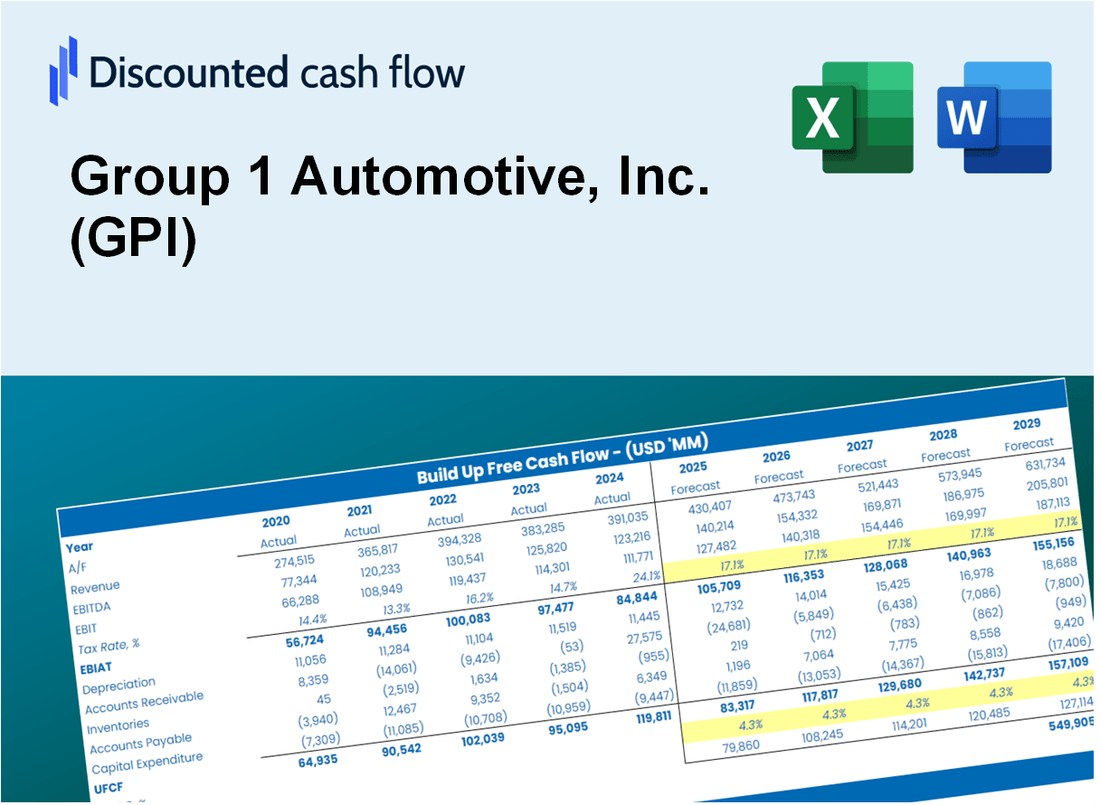
Discounted Cash Flow (DCF) - (USD MM)
| Year | AY1 2020 |
AY2 2021 |
AY3 2022 |
AY4 2023 |
AY5 2024 |
FY1 2025 |
FY2 2026 |
FY3 2027 |
FY4 2028 |
FY5 2029 |
|---|---|---|---|---|---|---|---|---|---|---|
| Revenue | 10,600.2 | 13,481.9 | 16,222.1 | 17,873.7 | 19,934.4 | 23,384.1 | 27,430.7 | 32,177.7 | 37,746.1 | 44,278.1 |
| Revenue Growth, % | 0 | 27.19 | 20.33 | 10.18 | 11.53 | 17.31 | 17.31 | 17.31 | 17.31 | 17.31 |
| EBITDA | 557.7 | 963.2 | 1,179.4 | 1,056.1 | 1,021.4 | 1,436.2 | 1,684.7 | 1,976.3 | 2,318.2 | 2,719.4 |
| EBITDA, % | 5.26 | 7.14 | 7.27 | 5.91 | 5.12 | 6.14 | 6.14 | 6.14 | 6.14 | 6.14 |
| Depreciation | 75.8 | 78.9 | 89.3 | 92.0 | 113.1 | 137.2 | 160.9 | 188.7 | 221.4 | 259.7 |
| Depreciation, % | 0.71508 | 0.58523 | 0.55048 | 0.51472 | 0.56736 | 0.58658 | 0.58658 | 0.58658 | 0.58658 | 0.58658 |
| EBIT | 481.9 | 884.3 | 1,090.1 | 964.1 | 908.3 | 1,299.0 | 1,523.8 | 1,787.5 | 2,096.8 | 2,459.7 |
| EBIT, % | 4.55 | 6.56 | 6.72 | 5.39 | 4.56 | 5.56 | 5.56 | 5.56 | 5.56 | 5.56 |
| Total Cash | 69.0 | 14.9 | 47.9 | 57.2 | 34.4 | 72.5 | 85.0 | 99.7 | 117.0 | 137.2 |
| Total Cash, percent | .0 | .0 | .0 | .0 | .0 | .0 | .0 | .0 | .0 | .0 |
| Account Receivables | 402.7 | 396.8 | 477.7 | 607.5 | 663.2 | 767.6 | 900.4 | 1,056.2 | 1,239.0 | 1,453.4 |
| Account Receivables, % | 3.8 | 2.94 | 2.94 | 3.4 | 3.33 | 3.28 | 3.28 | 3.28 | 3.28 | 3.28 |
| Inventories | 1,446.4 | 1,073.1 | 1,356.6 | 1,963.4 | 2,636.8 | 2,533.9 | 2,972.4 | 3,486.7 | 4,090.1 | 4,797.9 |
| Inventories, % | 13.65 | 7.96 | 8.36 | 10.98 | 13.23 | 10.84 | 10.84 | 10.84 | 10.84 | 10.84 |
| Accounts Payable | 430.4 | 457.8 | 488.0 | 499.3 | 738.0 | 793.2 | 930.4 | 1,091.5 | 1,280.3 | 1,501.9 |
| Accounts Payable, % | 4.06 | 3.4 | 3.01 | 2.79 | 3.7 | 3.39 | 3.39 | 3.39 | 3.39 | 3.39 |
| Capital Expenditure | -103.2 | -143.6 | -155.5 | -185.4 | -245.1 | -246.2 | -288.8 | -338.8 | -397.4 | -466.2 |
| Capital Expenditure, % | -0.97357 | -1.07 | -0.95857 | -1.04 | -1.23 | -1.05 | -1.05 | -1.05 | -1.05 | -1.05 |
| Tax Rate, % | 24.34 | 24.34 | 24.34 | 24.34 | 24.34 | 24.34 | 24.34 | 24.34 | 24.34 | 24.34 |
| EBITAT | 362.6 | 609.6 | 831.4 | 724.8 | 687.2 | 964.6 | 1,131.5 | 1,327.3 | 1,557.0 | 1,826.5 |
| Depreciation | ||||||||||
| Changes in Account Receivables | ||||||||||
| Changes in Inventories | ||||||||||
| Changes in Accounts Payable | ||||||||||
| Capital Expenditure | ||||||||||
| UFCF | -1,083.5 | 951.5 | 431.0 | -93.9 | 64.8 | 909.3 | 569.6 | 668.1 | 783.7 | 919.4 |
| WACC, % | 5.79 | 5.64 | 5.82 | 5.79 | 5.8 | 5.77 | 5.77 | 5.77 | 5.77 | 5.77 |
| PV UFCF | ||||||||||
| SUM PV UFCF | 3,254.4 | |||||||||
| Long Term Growth Rate, % | 0.50 | |||||||||
| Free cash flow (T + 1) | 924 | |||||||||
| Terminal Value | 17,542 | |||||||||
| Present Terminal Value | 13,253 | |||||||||
| Enterprise Value | 16,507 | |||||||||
| Net Debt | 5,203 | |||||||||
| Equity Value | 11,305 | |||||||||
| Diluted Shares Outstanding, MM | 13 | |||||||||
| Equity Value Per Share | 851.32 |
What You Will Get
- Real GPI Financials: Access to historical and projected data for precise valuation.
- Customizable Inputs: Adjust WACC, tax rates, revenue growth, and capital expenditures to fit your analysis.
- Dynamic Calculations: Intrinsic value and NPV are automatically calculated for you.
- Scenario Analysis: Explore various scenarios to assess Group 1 Automotive’s future performance.
- User-Friendly Design: Designed for professionals while remaining approachable for newcomers.
Key Features
- Comprehensive DCF Calculator: Features detailed unlevered and levered DCF valuation models tailored for Group 1 Automotive, Inc. (GPI).
- WACC Calculator: Pre-configured Weighted Average Cost of Capital sheet with adjustable inputs specific to the automotive sector.
- Customizable Forecast Assumptions: Easily adjust growth rates, capital expenditures, and discount rates to fit market conditions.
- Integrated Financial Ratios: Evaluate profitability, leverage, and efficiency ratios specifically for Group 1 Automotive, Inc. (GPI).
- Interactive Dashboard and Charts: Visual representations highlight key valuation metrics for straightforward analysis.
How It Works
- Download: Get the ready-to-use Excel file featuring Group 1 Automotive, Inc.'s (GPI) financial data.
- Customize: Modify forecasts, such as revenue growth, EBITDA %, and WACC.
- Update Automatically: The intrinsic value and NPV calculations refresh in real-time.
- Test Scenarios: Develop various projections and instantly compare results.
- Make Decisions: Leverage the valuation outcomes to inform your investment strategy.
Why Choose This Calculator for Group 1 Automotive, Inc. (GPI)?
- Accurate Data: Utilize real Group 1 Automotive financials for dependable valuation outcomes.
- Customizable: Tailor essential parameters such as growth rates, WACC, and tax rates to align with your forecasts.
- Time-Saving: Pre-built calculations streamline the process, removing the need to start from scratch.
- Professional-Grade Tool: Crafted for investors, analysts, and consultants in the automotive sector.
- User-Friendly: Intuitive design and clear instructions make it accessible for all users.
Who Should Use This Product?
- Individual Investors: Make informed decisions about buying or selling Group 1 Automotive, Inc. (GPI) stock.
- Financial Analysts: Streamline valuation processes with ready-to-use financial models specifically for Group 1 Automotive, Inc. (GPI).
- Consultants: Deliver professional valuation insights for Group 1 Automotive, Inc. (GPI) to clients quickly and accurately.
- Business Owners: Understand how automotive companies like Group 1 Automotive, Inc. (GPI) are valued to guide your own strategy.
- Finance Students: Learn valuation techniques using real-world data and scenarios related to Group 1 Automotive, Inc. (GPI).
What the Template Contains
- Preloaded GPI Data: Historical and projected financial data, including revenue, EBIT, and capital expenditures.
- DCF and WACC Models: Professional-grade sheets for calculating intrinsic value and Weighted Average Cost of Capital.
- Editable Inputs: Yellow-highlighted cells for adjusting revenue growth, tax rates, and discount rates.
- Financial Statements: Comprehensive annual and quarterly financials for deeper analysis.
- Key Ratios: Profitability, leverage, and efficiency ratios to evaluate performance.
- Dashboard and Charts: Visual summaries of valuation outcomes and assumptions.
Disclaimer
All information, articles, and product details provided on this website are for general informational and educational purposes only. We do not claim any ownership over, nor do we intend to infringe upon, any trademarks, copyrights, logos, brand names, or other intellectual property mentioned or depicted on this site. Such intellectual property remains the property of its respective owners, and any references here are made solely for identification or informational purposes, without implying any affiliation, endorsement, or partnership.
We make no representations or warranties, express or implied, regarding the accuracy, completeness, or suitability of any content or products presented. Nothing on this website should be construed as legal, tax, investment, financial, medical, or other professional advice. In addition, no part of this site—including articles or product references—constitutes a solicitation, recommendation, endorsement, advertisement, or offer to buy or sell any securities, franchises, or other financial instruments, particularly in jurisdictions where such activity would be unlawful.
All content is of a general nature and may not address the specific circumstances of any individual or entity. It is not a substitute for professional advice or services. Any actions you take based on the information provided here are strictly at your own risk. You accept full responsibility for any decisions or outcomes arising from your use of this website and agree to release us from any liability in connection with your use of, or reliance upon, the content or products found herein.