
|
Greenlam Industries Limited (Greenlam.NS) Évaluation DCF |
Entièrement Modifiable: Adapté À Vos Besoins Dans Excel Ou Sheets
Conception Professionnelle: Modèles Fiables Et Conformes Aux Normes Du Secteur
Pré-Construits Pour Une Utilisation Rapide Et Efficace
Compatible MAC/PC, entièrement débloqué
Aucune Expertise N'Est Requise; Facile À Suivre
Greenlam Industries Limited (GREENLAM.NS) Bundle
Explorez l'avenir financier de Greenlam Industries Limited avec notre calculatrice DCF conviviale! Entrez votre croissance, vos marges et vos hypothèses de coûts pour calculer la valeur intrinsèque de Greenlam Industries Limited et améliorer votre stratégie d'investissement.
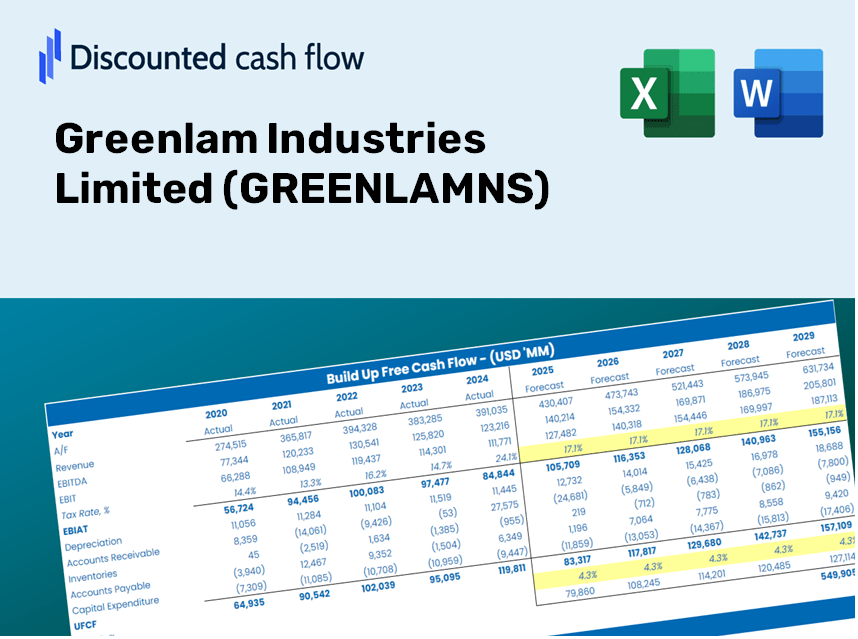
Discounted Cash Flow (DCF) - (USD MM)
| Year | AY1 2021 |
AY2 2022 |
AY3 2023 |
AY4 2024 |
AY5 2025 |
FY1 2026 |
FY2 2027 |
FY3 2028 |
FY4 2029 |
FY5 2030 |
|---|---|---|---|---|---|---|---|---|---|---|
| Revenue | 11,691.8 | 17,034.0 | 19,937.5 | 23,063.5 | 25,693.4 | 31,462.8 | 38,527.7 | 47,179.1 | 57,773.1 | 70,745.9 |
| Revenue Growth, % | 0 | 45.69 | 17.04 | 15.68 | 11.4 | 22.45 | 22.45 | 22.45 | 22.45 | 22.45 |
| EBITDA | 1,684.5 | 1,917.1 | 2,508.4 | 3,163.2 | 2,856.0 | 3,969.0 | 4,860.2 | 5,951.6 | 7,288.0 | 8,924.5 |
| EBITDA, % | 14.41 | 11.25 | 12.58 | 13.72 | 11.12 | 12.61 | 12.61 | 12.61 | 12.61 | 12.61 |
| Depreciation | 555.6 | 585.0 | 632.5 | 870.9 | 1,137.2 | 1,230.9 | 1,507.3 | 1,845.7 | 2,260.2 | 2,767.7 |
| Depreciation, % | 4.75 | 3.43 | 3.17 | 3.78 | 4.43 | 3.91 | 3.91 | 3.91 | 3.91 | 3.91 |
| EBIT | 1,128.9 | 1,332.2 | 1,875.9 | 2,292.3 | 1,718.8 | 2,738.1 | 3,352.9 | 4,105.8 | 5,027.8 | 6,156.8 |
| EBIT, % | 9.66 | 7.82 | 9.41 | 9.94 | 6.69 | 8.7 | 8.7 | 8.7 | 8.7 | 8.7 |
| Total Cash | 1,250.3 | 1,764.0 | 2,589.9 | 1,801.9 | 985.8 | 2,875.1 | 3,520.7 | 4,311.2 | 5,279.3 | 6,464.7 |
| Total Cash, percent | .0 | .0 | .0 | .0 | .0 | .0 | .0 | .0 | .0 | .0 |
| Account Receivables | 1,496.6 | 1,498.3 | 1,427.0 | 1,514.7 | 1,574.0 | 2,608.1 | 3,193.8 | 3,910.9 | 4,789.1 | 5,864.5 |
| Account Receivables, % | 12.8 | 8.8 | 7.16 | 6.57 | 6.13 | 8.29 | 8.29 | 8.29 | 8.29 | 8.29 |
| Inventories | 3,781.1 | 5,034.3 | 5,134.9 | 6,091.0 | 6,647.1 | 8,805.2 | 10,782.4 | 13,203.6 | 16,168.4 | 19,799.0 |
| Inventories, % | 32.34 | 29.55 | 25.76 | 26.41 | 25.87 | 27.99 | 27.99 | 27.99 | 27.99 | 27.99 |
| Accounts Payable | 2,227.6 | 2,558.1 | 2,753.1 | 3,479.5 | 4,146.3 | 4,977.6 | 6,095.3 | 7,464.0 | 9,140.0 | 11,192.4 |
| Accounts Payable, % | 19.05 | 15.02 | 13.81 | 15.09 | 16.14 | 15.82 | 15.82 | 15.82 | 15.82 | 15.82 |
| Capital Expenditure | -499.1 | -871.1 | -4,723.0 | -6,353.3 | -2,676.0 | -4,469.9 | -5,473.6 | -6,702.7 | -8,207.8 | -10,050.8 |
| Capital Expenditure, % | -4.27 | -5.11 | -23.69 | -27.55 | -10.42 | -14.21 | -14.21 | -14.21 | -14.21 | -14.21 |
| Tax Rate, % | 34.5 | 34.5 | 34.5 | 34.5 | 34.5 | 34.5 | 34.5 | 34.5 | 34.5 | 34.5 |
| EBITAT | 867.7 | 1,014.6 | 1,471.1 | 1,715.4 | 1,125.9 | 2,036.0 | 2,493.1 | 3,052.9 | 3,738.5 | 4,578.0 |
| Depreciation | ||||||||||
| Changes in Account Receivables | ||||||||||
| Changes in Inventories | ||||||||||
| Changes in Accounts Payable | ||||||||||
| Capital Expenditure | ||||||||||
| UFCF | -2,126.0 | -195.9 | -2,453.7 | -4,084.5 | -361.5 | -3,564.0 | -2,918.3 | -3,573.7 | -4,376.1 | -5,358.8 |
| WACC, % | 4.8 | 4.79 | 4.82 | 4.77 | 4.63 | 4.76 | 4.76 | 4.76 | 4.76 | 4.76 |
| PV UFCF | ||||||||||
| SUM PV UFCF | -17,050.0 | |||||||||
| Long Term Growth Rate, % | 4.00 | |||||||||
| Free cash flow (T + 1) | -5,573 | |||||||||
| Terminal Value | -733,564 | |||||||||
| Present Terminal Value | -581,388 | |||||||||
| Enterprise Value | -598,438 | |||||||||
| Net Debt | 11,562 | |||||||||
| Equity Value | -610,000 | |||||||||
| Diluted Shares Outstanding, MM | 130 | |||||||||
| Equity Value Per Share | -4,703.38 |
Benefits You Will Enjoy
- Comprehensive Financial Model: Leverage Greenlam's actual performance data for accurate DCF valuation.
- Complete Forecast Flexibility: Modify revenue growth, profit margins, WACC, and other critical factors.
- Real-Time Calculations: Instant updates provide immediate insights as you alter variables.
- Professional-Grade Template: A polished Excel file crafted for top-tier valuation needs.
- Adaptable and Repeatable: Designed for customization, making it easy to use for in-depth forecasts time and again.
Key Features
- Customizable Forecast Inputs: Adjust essential variables such as revenue growth, EBITDA margins, and capital expenditures with ease.
- Instant DCF Valuation: Automatically computes intrinsic value, NPV, and additional metrics quickly.
- High Precision Accuracy: Leverages Greenlam Industries Limited's (GREENLAMNS) actual financial data for credible valuation results.
- Effortless Scenario Analysis: Evaluate various assumptions and assess outcomes without hassle.
- Efficiency Boosting Tool: Remove the necessity for crafting intricate valuation models from the ground up.
How It Functions
- Download the Template: Gain immediate access to the Excel-based GREENLAM DCF Calculator.
- Input Your Assumptions: Modify the yellow-highlighted cells for growth rates, WACC, margins, and more.
- Instant Calculations: The model automatically recalculates Greenlam's intrinsic value.
- Test Scenarios: Experiment with different assumptions to assess potential valuation shifts.
- Analyze and Decide: Utilize the results to inform your investment or financial analysis.
Why Choose This Calculator for Greenlam Industries Limited?
- User-Friendly Design: Tailored for both novice users and seasoned professionals.
- Customizable Inputs: Easily adjust parameters to suit your specific analysis.
- Real-Time Updates: Witness instant changes to Greenlam’s valuation as you modify inputs.
- Preloaded Data: Comes equipped with Greenlam's latest financial information for swift evaluations.
- Favored by Experts: Trusted by investors and analysts for making well-informed decisions.
Who Can Benefit from GREENLAMNS?
- Investors: Make informed decisions with our professional-grade valuation tool tailored for your needs.
- Financial Analysts: Streamline your workflow with an easily customizable pre-built DCF model.
- Consultants: Effortlessly modify the template for client presentations or detailed reports.
- Finance Enthusiasts: Enhance your valuation expertise through practical, real-world examples.
- Educators and Students: Utilize this tool as an effective resource in finance-related coursework.
What the Template Includes
- Extensive DCF Model: Editable template featuring thorough valuation calculations.
- Real-World Data: Greenlam Industries Limited’s historical and projected financials preloaded for analysis.
- Customizable Parameters: Modify WACC, growth rates, and tax assumptions to explore various scenarios.
- Financial Statements: Complete annual and quarterly breakdowns for in-depth insights.
- Key Ratios: Integrated analysis for evaluating profitability, efficiency, and leverage.
- Dashboard with Visual Outputs: Graphs and tables to provide clear, actionable results.
Disclaimer
All information, articles, and product details provided on this website are for general informational and educational purposes only. We do not claim any ownership over, nor do we intend to infringe upon, any trademarks, copyrights, logos, brand names, or other intellectual property mentioned or depicted on this site. Such intellectual property remains the property of its respective owners, and any references here are made solely for identification or informational purposes, without implying any affiliation, endorsement, or partnership.
We make no representations or warranties, express or implied, regarding the accuracy, completeness, or suitability of any content or products presented. Nothing on this website should be construed as legal, tax, investment, financial, medical, or other professional advice. In addition, no part of this site—including articles or product references—constitutes a solicitation, recommendation, endorsement, advertisement, or offer to buy or sell any securities, franchises, or other financial instruments, particularly in jurisdictions where such activity would be unlawful.
All content is of a general nature and may not address the specific circumstances of any individual or entity. It is not a substitute for professional advice or services. Any actions you take based on the information provided here are strictly at your own risk. You accept full responsibility for any decisions or outcomes arising from your use of this website and agree to release us from any liability in connection with your use of, or reliance upon, the content or products found herein.