
|
Greggs plc (Grg.L) Valation DCF |
Entièrement Modifiable: Adapté À Vos Besoins Dans Excel Ou Sheets
Conception Professionnelle: Modèles Fiables Et Conformes Aux Normes Du Secteur
Pré-Construits Pour Une Utilisation Rapide Et Efficace
Compatible MAC/PC, entièrement débloqué
Aucune Expertise N'Est Requise; Facile À Suivre
Greggs plc (GRG.L) Bundle
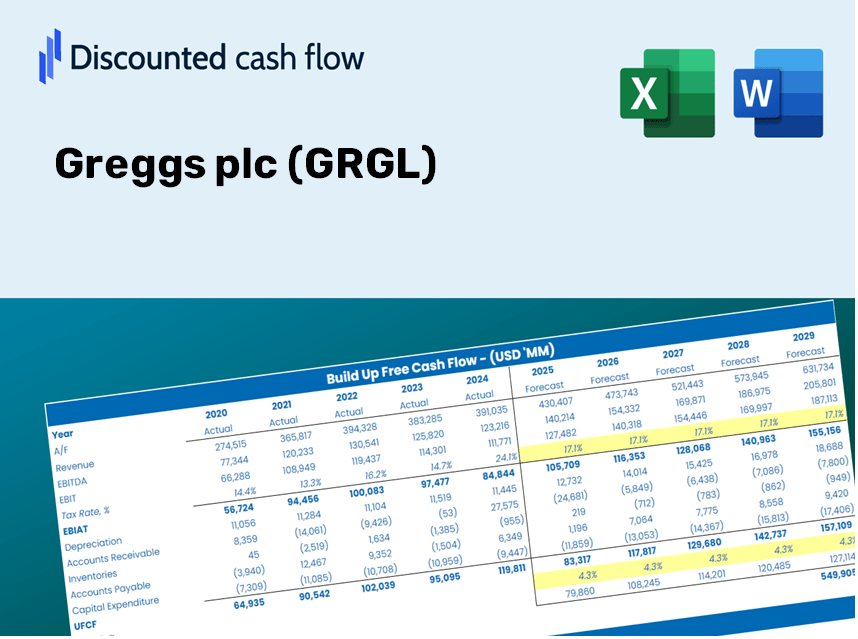
Vous cherchez à évaluer la valeur intrinsèque de Greggs plc? Notre calculatrice GRGL DCF intègre des données réelles avec des fonctionnalités de personnalisation étendues, vous permettant d'affiner vos projections et d'améliorer vos stratégies d'investissement.
Discounted Cash Flow (DCF) - (USD MM)
| Year | AY1 2020 |
AY2 2021 |
AY3 2022 |
AY4 2023 |
AY5 2024 |
FY1 2025 |
FY2 2026 |
FY3 2027 |
FY4 2028 |
FY5 2029 |
|---|---|---|---|---|---|---|---|---|---|---|
| Revenue | 811.3 | 1,229.7 | 1,512.8 | 1,809.6 | 2,014.4 | 2,545.8 | 3,217.5 | 4,066.4 | 5,139.2 | 6,495.0 |
| Revenue Growth, % | 0 | 51.57 | 23.02 | 19.62 | 11.32 | 26.38 | 26.38 | 26.38 | 26.38 | 26.38 |
| EBITDA | 106.4 | 260.4 | 271.3 | 323.6 | 357.5 | 447.3 | 565.3 | 714.5 | 903.0 | 1,141.2 |
| EBITDA, % | 13.11 | 21.18 | 17.93 | 17.88 | 17.75 | 17.57 | 17.57 | 17.57 | 17.57 | 17.57 |
| Depreciation | 112.8 | 107.4 | 115.5 | 125.0 | 140.0 | 224.7 | 284.0 | 358.9 | 453.6 | 573.2 |
| Depreciation, % | 13.9 | 8.73 | 7.63 | 6.91 | 6.95 | 8.83 | 8.83 | 8.83 | 8.83 | 8.83 |
| EBIT | -6.4 | 153.0 | 155.8 | 198.6 | 217.5 | 222.6 | 281.4 | 355.6 | 449.4 | 568.0 |
| EBIT, % | -0.78886 | 12.44 | 10.3 | 10.97 | 10.8 | 8.74 | 8.74 | 8.74 | 8.74 | 8.74 |
| Total Cash | 36.8 | 198.6 | 191.6 | 195.3 | 125.3 | 256.4 | 324.1 | 409.6 | 517.7 | 654.2 |
| Total Cash, percent | .0 | .0 | .0 | .0 | .0 | .0 | .0 | .0 | .0 | .0 |
| Account Receivables | 33.4 | 31.9 | 40.6 | 33.3 | 48.8 | 69.5 | 87.9 | 111.1 | 140.4 | 177.4 |
| Account Receivables, % | 4.12 | 2.59 | 2.68 | 1.84 | 2.42 | 2.73 | 2.73 | 2.73 | 2.73 | 2.73 |
| Inventories | 22.5 | 27.9 | 40.6 | 48.8 | 55.2 | 67.0 | 84.7 | 107.1 | 135.3 | 171.0 |
| Inventories, % | 2.77 | 2.27 | 2.68 | 2.7 | 2.74 | 2.63 | 2.63 | 2.63 | 2.63 | 2.63 |
| Accounts Payable | 48.8 | 74.1 | 102.8 | 99.1 | 120.5 | 154.3 | 194.9 | 246.4 | 311.4 | 393.5 |
| Accounts Payable, % | 6.02 | 6.03 | 6.8 | 5.48 | 5.98 | 6.06 | 6.06 | 6.06 | 6.06 | 6.06 |
| Capital Expenditure | -61.6 | -54.3 | -103.3 | -198.1 | -240.9 | -212.5 | -268.6 | -339.5 | -429.0 | -542.2 |
| Capital Expenditure, % | -7.59 | -4.42 | -6.83 | -10.95 | -11.96 | -8.35 | -8.35 | -8.35 | -8.35 | -8.35 |
| Tax Rate, % | 24.77 | 24.77 | 24.77 | 24.77 | 24.77 | 24.77 | 24.77 | 24.77 | 24.77 | 24.77 |
| EBITAT | -6.1 | 123.5 | 126.4 | 150.3 | 163.6 | 181.5 | 229.4 | 289.9 | 366.4 | 463.0 |
| Depreciation | ||||||||||
| Changes in Account Receivables | ||||||||||
| Changes in Inventories | ||||||||||
| Changes in Accounts Payable | ||||||||||
| Capital Expenditure | ||||||||||
| UFCF | 38.0 | 198.0 | 145.9 | 72.6 | 62.2 | 194.8 | 249.4 | 315.2 | 398.4 | 503.5 |
| WACC, % | 8.59 | 8.48 | 8.49 | 8.44 | 8.44 | 8.49 | 8.49 | 8.49 | 8.49 | 8.49 |
| PV UFCF | ||||||||||
| SUM PV UFCF | 1,260.9 | |||||||||
| Long Term Growth Rate, % | 3.00 | |||||||||
| Free cash flow (T + 1) | 519 | |||||||||
| Terminal Value | 9,448 | |||||||||
| Present Terminal Value | 6,287 | |||||||||
| Enterprise Value | 7,547 | |||||||||
| Net Debt | 290 | |||||||||
| Equity Value | 7,258 | |||||||||
| Diluted Shares Outstanding, MM | 103 | |||||||||
| Equity Value Per Share | 7,076.65 |
What You Will Receive
- Authentic Greggs Data: Comprehensive financials – from revenue to EBIT – utilizing actual and projected figures for Greggs plc (GRGL).
- Complete Customization: Modify all key parameters (yellow cells) such as WACC, growth %, and tax rates as needed.
- Real-Time Valuation Updates: Automatic recalculations to assess the effects of any changes on Greggs’ fair value.
- Flexible Excel Template: Designed for quick alterations, scenario analysis, and in-depth forecasting.
- Efficient and Precise: Eliminate the need to start models from scratch while ensuring accuracy and adaptability.
Key Features
- 🔍 Real-Life GRGL Financials: Pre-filled historical and projected data for Greggs plc.
- ✏️ Fully Customizable Inputs: Adjust all essential parameters (yellow cells) such as WACC, growth %, and tax rates.
- 📊 Professional DCF Valuation: Integrated formulas calculate Greggs’ intrinsic value using the Discounted Cash Flow method.
- ⚡ Instant Results: Visualize Greggs’ valuation immediately after making adjustments.
- Scenario Analysis: Evaluate and compare outcomes for different financial assumptions side-by-side.
How It Functions
- 1. Access the Template: Download and open the Excel file featuring Greggs plc’s (GRGL) preloaded data.
- 2. Modify Assumptions: Adjust essential parameters such as growth rates, WACC, and capital expenditures.
- 3. View Results Immediately: The DCF model automatically calculates intrinsic value and NPV.
- 4. Explore Scenarios: Evaluate various forecasts to investigate different valuation results.
- 5. Present with Assurance: Deliver professional valuation insights to enhance your decision-making.
Why Choose This Calculator for Greggs plc (GRGL)?
- All-in-One Solution: Combines DCF, WACC, and financial ratio analyses into a single, powerful tool.
- Flexible Inputs: Modify the yellow-highlighted fields to explore different scenarios.
- In-Depth Analysis: Automatically computes Greggs' intrinsic value and Net Present Value.
- Preloaded Information: Access to historical and projected data ensures reliable starting points.
- Expert Grade: Perfect for financial analysts, investors, and business consultants focusing on Greggs plc (GRGL).
Who Can Benefit from This Product?
- Finance Students: Master valuation methodologies and apply them with real-time data.
- Researchers: Utilize professional valuation models to enhance your academic projects.
- Investors: Validate your investment hypotheses and examine the valuation metrics for Greggs plc (GRGL).
- Financial Analysts: Optimize your analysis process with a ready-to-use, customizable DCF model.
- Small Business Owners: Understand the valuation techniques used for large public entities like Greggs plc (GRGL).
Contents of the Template
- Comprehensive DCF Model: Editable template featuring in-depth valuation calculations.
- Real-World Data: Preloaded historical and projected financials for Greggs plc (GRGL) to facilitate analysis.
- Customizable Parameters: Modify WACC, growth rates, and tax assumptions to explore various scenarios.
- Financial Statements: Complete annual and quarterly breakdowns for enhanced insights.
- Key Ratios: Integrated analysis for assessing profitability, efficiency, and leverage.
- Dashboard with Visual Outputs: Visualizations including charts and tables for clear, actionable results.
Disclaimer
All information, articles, and product details provided on this website are for general informational and educational purposes only. We do not claim any ownership over, nor do we intend to infringe upon, any trademarks, copyrights, logos, brand names, or other intellectual property mentioned or depicted on this site. Such intellectual property remains the property of its respective owners, and any references here are made solely for identification or informational purposes, without implying any affiliation, endorsement, or partnership.
We make no representations or warranties, express or implied, regarding the accuracy, completeness, or suitability of any content or products presented. Nothing on this website should be construed as legal, tax, investment, financial, medical, or other professional advice. In addition, no part of this site—including articles or product references—constitutes a solicitation, recommendation, endorsement, advertisement, or offer to buy or sell any securities, franchises, or other financial instruments, particularly in jurisdictions where such activity would be unlawful.
All content is of a general nature and may not address the specific circumstances of any individual or entity. It is not a substitute for professional advice or services. Any actions you take based on the information provided here are strictly at your own risk. You accept full responsibility for any decisions or outcomes arising from your use of this website and agree to release us from any liability in connection with your use of, or reliance upon, the content or products found herein.