
|
Jardin atteindre les constructeurs navals & Ingénieurs Limited (GRSE.NS) Évaluation DCF |
Entièrement Modifiable: Adapté À Vos Besoins Dans Excel Ou Sheets
Conception Professionnelle: Modèles Fiables Et Conformes Aux Normes Du Secteur
Pré-Construits Pour Une Utilisation Rapide Et Efficace
Compatible MAC/PC, entièrement débloqué
Aucune Expertise N'Est Requise; Facile À Suivre
Garden Reach Shipbuilders & Engineers Limited (GRSE.NS) Bundle
Cherche à évaluer la valeur intrinsèque de Garden Reach Shipbuilders & Engineers Limited? Notre calculatrice GRSENS DCF intègre des données réelles avec des fonctionnalités de personnalisation complètes, vous permettant d'affiner les prévisions et de faire des choix d'investissement plus éclairés.
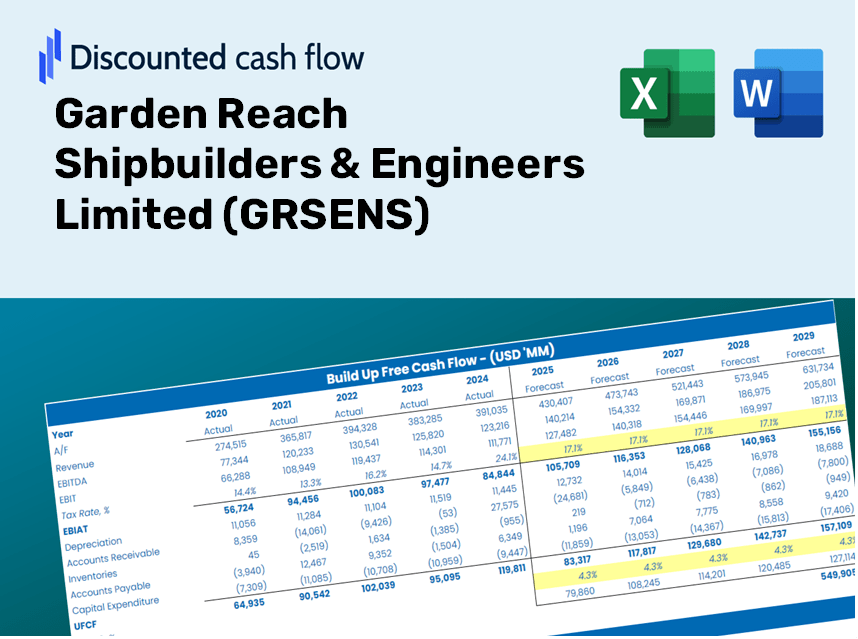
Discounted Cash Flow (DCF) - (USD MM)
| Year | AY1 2021 |
AY2 2022 |
AY3 2023 |
AY4 2024 |
AY5 2025 |
FY1 2026 |
FY2 2027 |
FY3 2028 |
FY4 2029 |
FY5 2030 |
|---|---|---|---|---|---|---|---|---|---|---|
| Revenue | 11,408.4 | 17,544.5 | 25,611.5 | 35,926.4 | 50,756.9 | 47,644.6 | 44,723.1 | 41,980.7 | 39,406.5 | 36,990.2 |
| Revenue Growth, % | 0 | 53.79 | 45.98 | 40.27 | 41.28 | -6.13 | -6.13 | -6.13 | -6.13 | -6.13 |
| EBITDA | 2,389.1 | 2,947.7 | 3,512.1 | 5,349.0 | 7,561.0 | 7,741.4 | 7,266.7 | 6,821.1 | 6,402.9 | 6,010.2 |
| EBITDA, % | 20.94 | 16.8 | 13.71 | 14.89 | 14.9 | 16.25 | 16.25 | 16.25 | 16.25 | 16.25 |
| Depreciation | 290.9 | 363.0 | 391.7 | 413.3 | 424.9 | 775.2 | 727.7 | 683.0 | 641.2 | 601.8 |
| Depreciation, % | 2.55 | 2.07 | 1.53 | 1.15 | 0.83717 | 1.63 | 1.63 | 1.63 | 1.63 | 1.63 |
| EBIT | 2,098.2 | 2,584.7 | 3,120.5 | 4,935.7 | 7,136.1 | 6,966.2 | 6,539.0 | 6,138.1 | 5,761.7 | 5,408.4 |
| EBIT, % | 18.39 | 14.73 | 12.18 | 13.74 | 14.06 | 14.62 | 14.62 | 14.62 | 14.62 | 14.62 |
| Total Cash | 28,079.3 | 23,302.8 | 41,419.2 | 33,811.9 | 39,367.7 | 44,945.5 | 42,189.5 | 39,602.6 | 37,174.2 | 34,894.7 |
| Total Cash, percent | .0 | .0 | .0 | .0 | .0 | .0 | .0 | .0 | .0 | .0 |
| Account Receivables | 2,580.8 | 2,395.2 | 1,363.5 | 2,805.1 | 2,594.6 | 5,195.0 | 4,876.4 | 4,577.4 | 4,296.7 | 4,033.3 |
| Account Receivables, % | 22.62 | 13.65 | 5.32 | 7.81 | 5.11 | 10.9 | 10.9 | 10.9 | 10.9 | 10.9 |
| Inventories | 7,878.7 | 11,722.7 | 29,185.0 | 39,844.4 | 35,522.5 | 38,674.4 | 36,302.9 | 34,076.9 | 31,987.4 | 30,026.0 |
| Inventories, % | 69.06 | 66.82 | 113.95 | 110.91 | 69.99 | 81.17 | 81.17 | 81.17 | 81.17 | 81.17 |
| Accounts Payable | 7,827.2 | 4,116.9 | 11,738.7 | 9,924.2 | 11,514.1 | 17,935.0 | 16,835.2 | 15,802.9 | 14,833.9 | 13,924.3 |
| Accounts Payable, % | 68.61 | 23.47 | 45.83 | 27.62 | 22.68 | 37.64 | 37.64 | 37.64 | 37.64 | 37.64 |
| Capital Expenditure | -1,638.4 | -548.3 | -422.6 | -480.7 | -670.6 | -2,076.9 | -1,949.6 | -1,830.0 | -1,717.8 | -1,612.5 |
| Capital Expenditure, % | -14.36 | -3.13 | -1.65 | -1.34 | -1.32 | -4.36 | -4.36 | -4.36 | -4.36 | -4.36 |
| Tax Rate, % | 25.01 | 25.01 | 25.01 | 25.01 | 25.01 | 25.01 | 25.01 | 25.01 | 25.01 | 25.01 |
| EBITAT | 1,554.7 | 1,904.3 | 2,332.3 | 3,666.7 | 5,351.4 | 5,180.0 | 4,862.4 | 4,564.2 | 4,284.4 | 4,021.6 |
| Depreciation | ||||||||||
| Changes in Account Receivables | ||||||||||
| Changes in Inventories | ||||||||||
| Changes in Accounts Payable | ||||||||||
| Capital Expenditure | ||||||||||
| UFCF | -2,425.2 | -5,649.6 | -6,507.5 | -10,316.1 | 11,228.1 | 4,546.9 | 5,230.7 | 4,910.0 | 4,608.9 | 4,326.3 |
| WACC, % | 4.85 | 4.85 | 4.85 | 4.85 | 4.85 | 4.85 | 4.85 | 4.85 | 4.85 | 4.85 |
| PV UFCF | ||||||||||
| SUM PV UFCF | 20,580.0 | |||||||||
| Long Term Growth Rate, % | 4.00 | |||||||||
| Free cash flow (T + 1) | 4,499 | |||||||||
| Terminal Value | 527,330 | |||||||||
| Present Terminal Value | 416,076 | |||||||||
| Enterprise Value | 436,656 | |||||||||
| Net Debt | 58 | |||||||||
| Equity Value | 436,598 | |||||||||
| Diluted Shares Outstanding, MM | 115 | |||||||||
| Equity Value Per Share | 3,811.32 |
What You Will Receive
- Authentic GRSENS Data: Preloaded financial metrics – from revenue to EBIT – derived from actual and projected figures.
- Comprehensive Customization: Modify all essential parameters (yellow cells) such as WACC, growth %, and tax rates.
- Immediate Valuation Adjustments: Automatic recalculations to evaluate the effects of changes on GRSENS’s fair value.
- Flexible Excel Template: Designed for quick modifications, scenario analysis, and in-depth projections.
- Efficient and Precise: Eliminate the need to construct models from scratch while ensuring accuracy and adaptability.
Key Features
- Customizable Financial Inputs: Adjust essential variables such as revenue growth, EBITDA percentage, and capital investments.
- Instant DCF Valuation: Quickly computes intrinsic value, net present value (NPV), and other financial metrics.
- High-Level Accuracy: Leverages Garden Reach Shipbuilders & Engineers Limited’s (GRSENS) actual financial data for precise valuation results.
- Simplified Scenario Analysis: Effortlessly evaluate various assumptions and analyze their outcomes.
- Efficiency Booster: Reduce the need to create elaborate valuation models from the ground up.
How It Functions
- Download: Obtain the pre-configured Excel file containing Garden Reach Shipbuilders & Engineers Limited's (GRSENS) financial data.
- Customize: Tailor forecasts, such as revenue growth, EBITDA %, and WACC to suit your analysis.
- Update Automatically: Enjoy real-time updates on intrinsic value and NPV calculations.
- Test Scenarios: Simulate various projections and swiftly compare the results.
- Make Decisions: Leverage the valuation insights to inform your investment approach.
Why Choose This Calculator for Garden Reach Shipbuilders & Engineers Limited (GRSENS)?
- User-Friendly Interface: Tailored for both novices and seasoned professionals.
- Customizable Inputs: Effortlessly adjust parameters to suit your analysis needs.
- Real-Time Valuation Updates: Observe immediate changes to GRSENS’s valuation as you modify inputs.
- Pre-Loaded Financial Data: Comes equipped with GRSENS’s actual financial metrics for swift evaluations.
- Endorsed by Experts: Widely utilized by investors and analysts for making well-informed choices.
Who Can Benefit from GRSENS ([GRSENS])?
- Investors: Make informed choices with a reliable valuation tool tailored for the maritime industry.
- Financial Analysts: Save valuable time with our ready-to-customize DCF model specifically designed for shipbuilding and engineering.
- Consultants: Effortlessly modify the template for client presentations or comprehensive reports.
- Marine Industry Enthusiasts: Enhance your knowledge of valuation methods through practical, real-life examples from the maritime sector.
- Educators and Students: Utilize this resource as a hands-on learning aid in marine finance courses.
Contents of the Template
- Operating and Balance Sheet Data: Pre-filled historical data and forecasts for Garden Reach Shipbuilders & Engineers Limited (GRSENS), including revenue, EBITDA, EBIT, and capital expenditures.
- WACC Calculation: A dedicated sheet for calculating the Weighted Average Cost of Capital (WACC), featuring parameters such as Beta, risk-free rate, and share price.
- DCF Valuation (Unlevered and Levered): Customizable Discounted Cash Flow models presenting intrinsic value with comprehensive calculations.
- Financial Statements: Pre-loaded annual and quarterly financial statements to facilitate thorough analysis.
- Key Ratios: A collection of profitability, leverage, and efficiency ratios specific to Garden Reach Shipbuilders & Engineers Limited (GRSENS).
- Dashboard and Charts: A visual summary of valuation outputs and assumptions for easy result analysis.
Disclaimer
All information, articles, and product details provided on this website are for general informational and educational purposes only. We do not claim any ownership over, nor do we intend to infringe upon, any trademarks, copyrights, logos, brand names, or other intellectual property mentioned or depicted on this site. Such intellectual property remains the property of its respective owners, and any references here are made solely for identification or informational purposes, without implying any affiliation, endorsement, or partnership.
We make no representations or warranties, express or implied, regarding the accuracy, completeness, or suitability of any content or products presented. Nothing on this website should be construed as legal, tax, investment, financial, medical, or other professional advice. In addition, no part of this site—including articles or product references—constitutes a solicitation, recommendation, endorsement, advertisement, or offer to buy or sell any securities, franchises, or other financial instruments, particularly in jurisdictions where such activity would be unlawful.
All content is of a general nature and may not address the specific circumstances of any individual or entity. It is not a substitute for professional advice or services. Any actions you take based on the information provided here are strictly at your own risk. You accept full responsibility for any decisions or outcomes arising from your use of this website and agree to release us from any liability in connection with your use of, or reliance upon, the content or products found herein.