
|
GSI Technology, Inc. (GSIT) Évaluation DCF |
Entièrement Modifiable: Adapté À Vos Besoins Dans Excel Ou Sheets
Conception Professionnelle: Modèles Fiables Et Conformes Aux Normes Du Secteur
Pré-Construits Pour Une Utilisation Rapide Et Efficace
Compatible MAC/PC, entièrement débloqué
Aucune Expertise N'Est Requise; Facile À Suivre
GSI Technology, Inc. (GSIT) Bundle
Vous cherchez à évaluer la valeur intrinsèque de GSI Technology, Inc.? Notre calculatrice GSIT DCF intègre des données réelles avec des fonctionnalités de personnalisation approfondies, vous permettant d'affiner vos prévisions et d'améliorer vos stratégies d'investissement.
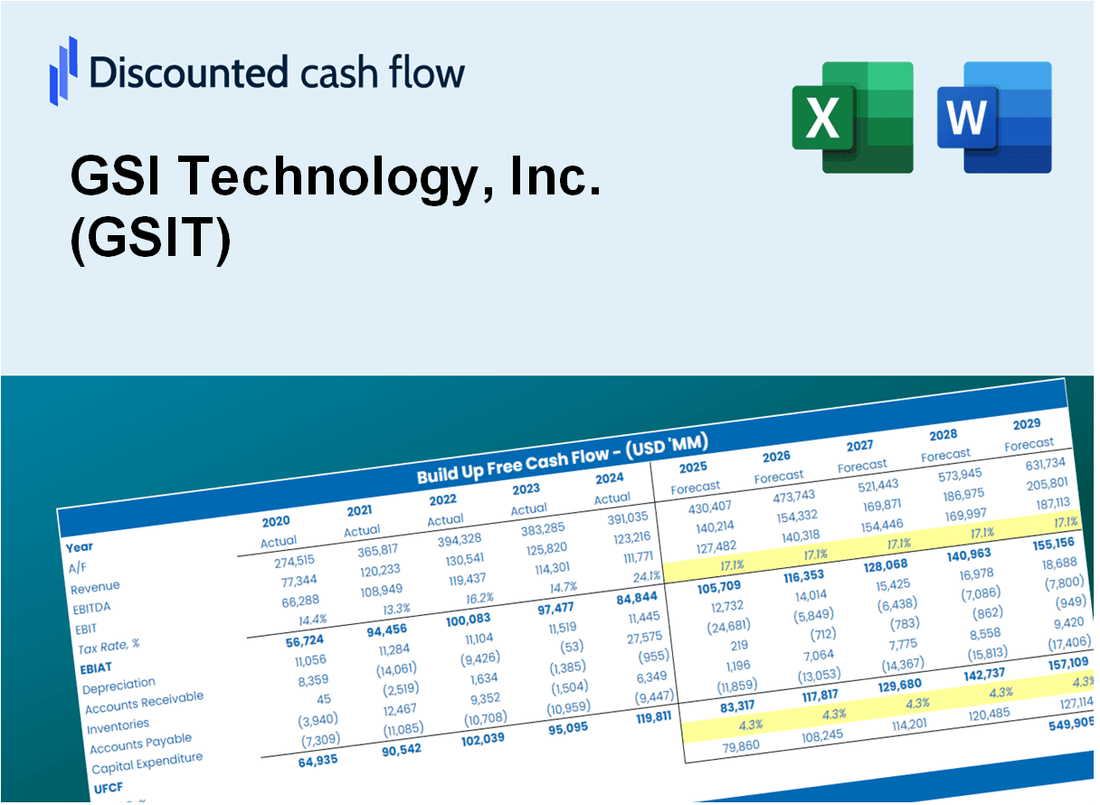
Discounted Cash Flow (DCF) - (USD MM)
| Year | AY1 2021 |
AY2 2022 |
AY3 2023 |
AY4 2024 |
AY5 2025 |
FY1 2026 |
FY2 2027 |
FY3 2028 |
FY4 2029 |
FY5 2030 |
|---|---|---|---|---|---|---|---|---|---|---|
| Revenue | 27.7 | 33.4 | 29.7 | 21.8 | 20.5 | 19.3 | 18.2 | 17.2 | 16.2 | 15.2 |
| Revenue Growth, % | 0 | 20.39 | -11.06 | -26.69 | -5.73 | -5.77 | -5.77 | -5.77 | -5.77 | -5.77 |
| EBITDA | -20.1 | -15.0 | -16.7 | -19.5 | -16.0 | -13.2 | -12.4 | -11.7 | -11.0 | -10.4 |
| EBITDA, % | -72.31 | -45.04 | -56.25 | -89.61 | -77.8 | -68.2 | -68.2 | -68.2 | -68.2 | -68.2 |
| Depreciation | 1.2 | 1.4 | 1.0 | .9 | .7 | .8 | .7 | .7 | .6 | .6 |
| Depreciation, % | 4.38 | 4.12 | 3.42 | 4.26 | 3.24 | 3.88 | 3.88 | 3.88 | 3.88 | 3.88 |
| EBIT | -21.3 | -16.4 | -17.7 | -20.4 | -16.6 | -13.9 | -13.1 | -12.4 | -11.7 | -11.0 |
| EBIT, % | -76.69 | -49.16 | -59.66 | -93.87 | -81.04 | -72.09 | -72.09 | -72.09 | -72.09 | -72.09 |
| Total Cash | 54.0 | 44.0 | 30.6 | 14.4 | 13.4 | 16.7 | 15.7 | 14.8 | 14.0 | 13.2 |
| Total Cash, percent | .0 | .0 | .0 | .0 | .0 | .0 | .0 | .0 | .0 | .0 |
| Account Receivables | 4.0 | 4.5 | 3.5 | 3.3 | 3.9 | 2.8 | 2.7 | 2.5 | 2.4 | 2.2 |
| Account Receivables, % | 14.27 | 13.53 | 11.69 | 15.31 | 18.83 | 14.73 | 14.73 | 14.73 | 14.73 | 14.73 |
| Inventories | 4.3 | 4.7 | 6.4 | 5.0 | 3.9 | 3.6 | 3.4 | 3.2 | 3.0 | 2.8 |
| Inventories, % | 15.66 | 13.94 | 21.61 | 22.87 | 18.96 | 18.61 | 18.61 | 18.61 | 18.61 | 18.61 |
| Accounts Payable | 1.5 | 1.6 | 1.6 | .7 | 1.0 | .9 | .9 | .8 | .8 | .7 |
| Accounts Payable, % | 5.32 | 4.86 | 5.46 | 3.07 | 4.83 | 4.71 | 4.71 | 4.71 | 4.71 | 4.71 |
| Capital Expenditure | -.2 | -.8 | -.3 | -.6 | .0 | -.3 | -.3 | -.3 | -.2 | -.2 |
| Capital Expenditure, % | -0.73209 | -2.32 | -1.06 | -2.96 | -0.21932 | -1.46 | -1.46 | -1.46 | -1.46 | -1.46 |
| Tax Rate, % | -1.24 | -1.24 | -1.24 | -1.24 | -1.24 | -1.24 | -1.24 | -1.24 | -1.24 | -1.24 |
| EBITAT | -21.6 | -16.4 | -18.1 | -20.5 | -16.8 | -13.9 | -13.1 | -12.4 | -11.7 | -11.0 |
| Depreciation | ||||||||||
| Changes in Account Receivables | ||||||||||
| Changes in Inventories | ||||||||||
| Changes in Accounts Payable | ||||||||||
| Capital Expenditure | ||||||||||
| UFCF | -27.4 | -16.5 | -18.2 | -19.6 | -15.3 | -12.2 | -12.4 | -11.6 | -11.0 | -10.3 |
| WACC, % | 10.1 | 10.09 | 10.1 | 10.1 | 10.1 | 10.1 | 10.1 | 10.1 | 10.1 | 10.1 |
| PV UFCF | ||||||||||
| SUM PV UFCF | -43.9 | |||||||||
| Long Term Growth Rate, % | 2.00 | |||||||||
| Free cash flow (T + 1) | -11 | |||||||||
| Terminal Value | -130 | |||||||||
| Present Terminal Value | -81 | |||||||||
| Enterprise Value | -124 | |||||||||
| Net Debt | -4 | |||||||||
| Equity Value | -121 | |||||||||
| Diluted Shares Outstanding, MM | 26 | |||||||||
| Equity Value Per Share | -4.72 |
What You Will Get
- GSI Technology Data: Preloaded financials – covering everything from revenue to EBIT – based on actual and projected figures for GSI Technology, Inc. (GSIT).
- Comprehensive Customization: Modify all essential parameters (yellow cells) such as WACC, growth %, and tax rates to fit your analysis.
- Instant Valuation Adjustments: Automatic recalculations to assess the effects of changes on GSI Technology's fair value.
- Flexible Excel Template: Designed for quick modifications, scenario analysis, and detailed forecasting.
- Efficient and Precise: Eliminate the need to build models from scratch while ensuring accuracy and adaptability.
Key Features
- Customizable Forecast Inputs: Adjust essential parameters such as revenue growth, gross margin %, and R&D expenses.
- Instant DCF Valuation: Quickly computes intrinsic value, NPV, and additional metrics.
- High-Precision Accuracy: Leverages GSI Technology's (GSIT) actual financial data for dependable valuation results.
- Simplified Scenario Analysis: Easily explore various assumptions and assess different outcomes.
- Efficiency Booster: Avoid the hassle of constructing intricate valuation models from the ground up.
How It Works
- Download: Obtain the pre-built Excel file containing GSI Technology, Inc.'s (GSIT) financial data.
- Customize: Modify projections, such as revenue growth, EBITDA %, and WACC.
- Update Automatically: Watch as intrinsic value and NPV calculations refresh in real-time.
- Test Scenarios: Develop various forecasts and instantly compare the results.
- Make Decisions: Leverage the valuation findings to inform your investment choices.
Why Choose This Calculator for GSI Technology, Inc. (GSIT)?
- User-Friendly Interface: Tailored for both novices and seasoned analysts.
- Customizable Inputs: Easily adjust parameters to suit your evaluation needs.
- Real-Time Feedback: Observe immediate updates to GSI's valuation as you modify inputs.
- Pre-Configured Data: Comes with GSI's current financial metrics for swift assessments.
- Relied Upon by Experts: A go-to tool for investors and analysts seeking to make strategic choices.
Who Should Use GSI Technology, Inc. (GSIT)?
- Investors: Gain insights and make informed investment choices with cutting-edge technology solutions.
- Financial Analysts: Streamline your analysis with comprehensive data and analytics tools tailored for the tech industry.
- Consultants: Effortlessly customize reports and presentations to showcase GSI Technology's innovative offerings to clients.
- Tech Enthusiasts: Enhance your knowledge of semiconductor technologies and their market applications through real-world case studies.
- Educators and Students: Utilize GSI Technology resources as a valuable educational tool in technology and finance courses.
What the Template Contains
- Operating and Balance Sheet Data: Pre-filled GSI Technology historical data and forecasts, including revenue, EBITDA, EBIT, and capital expenditures.
- WACC Calculation: A dedicated sheet for Weighted Average Cost of Capital (WACC), including parameters like Beta, risk-free rate, and share price.
- DCF Valuation (Unlevered and Levered): Editable Discounted Cash Flow models showing intrinsic value with detailed calculations.
- Financial Statements: Pre-loaded financial statements (annual and quarterly) to support analysis.
- Key Ratios: Includes profitability, leverage, and efficiency ratios for GSI Technology, Inc. (GSIT).
- Dashboard and Charts: Visual summary of valuation outputs and assumptions to analyze results easily.
Disclaimer
All information, articles, and product details provided on this website are for general informational and educational purposes only. We do not claim any ownership over, nor do we intend to infringe upon, any trademarks, copyrights, logos, brand names, or other intellectual property mentioned or depicted on this site. Such intellectual property remains the property of its respective owners, and any references here are made solely for identification or informational purposes, without implying any affiliation, endorsement, or partnership.
We make no representations or warranties, express or implied, regarding the accuracy, completeness, or suitability of any content or products presented. Nothing on this website should be construed as legal, tax, investment, financial, medical, or other professional advice. In addition, no part of this site—including articles or product references—constitutes a solicitation, recommendation, endorsement, advertisement, or offer to buy or sell any securities, franchises, or other financial instruments, particularly in jurisdictions where such activity would be unlawful.
All content is of a general nature and may not address the specific circumstances of any individual or entity. It is not a substitute for professional advice or services. Any actions you take based on the information provided here are strictly at your own risk. You accept full responsibility for any decisions or outcomes arising from your use of this website and agree to release us from any liability in connection with your use of, or reliance upon, the content or products found herein.