
|
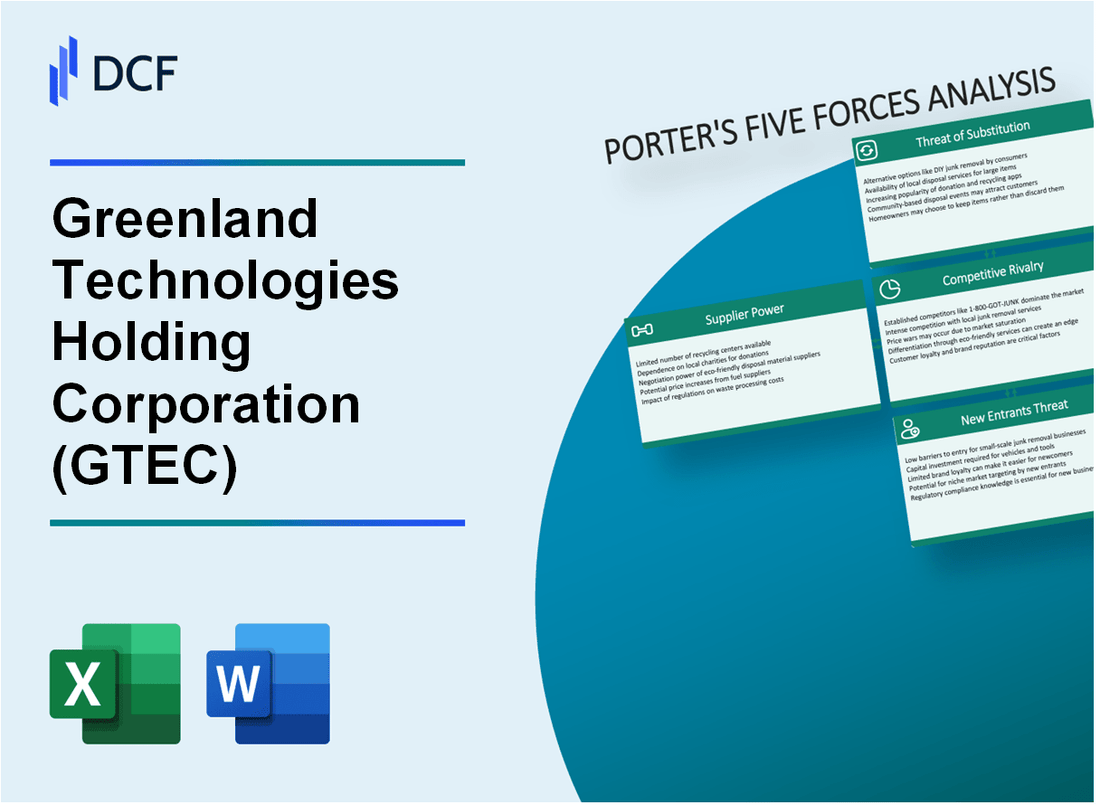
Groenland Technologies Holding Corporation (GTEC): 5 Analyse des forces [Jan-2025 MISE À JOUR] |
Entièrement Modifiable: Adapté À Vos Besoins Dans Excel Ou Sheets
Conception Professionnelle: Modèles Fiables Et Conformes Aux Normes Du Secteur
Pré-Construits Pour Une Utilisation Rapide Et Efficace
Compatible MAC/PC, entièrement débloqué
Aucune Expertise N'Est Requise; Facile À Suivre
Greenland Technologies Holding Corporation (GTEC) Bundle
Dans le paysage dynamique de la technologie de manutention des matériaux, Greenland Technologies Holding Corporation (GTEC) navigue dans un écosystème complexe de forces compétitives qui façonnent son positionnement stratégique. À mesure que l'innovation industrielle accélère et que la dynamique du marché évolue, la compréhension de l'interaction complexe de la puissance des fournisseurs, de la dynamique des clients, de l'intensité concurrentielle, de la substitution technologique et des obstacles potentiels à l'entrée du marché devient crucial pour déchiffrer l'avantage concurrentiel du GTEC. Cette analyse en profondeur du cadre des cinq forces de Porter révèle les défis et opportunités nuancées auxquelles sont confrontés ce fabricant spécialisé d'équipements industriels sur le marché mondial en transformation rapide.
Greenland Technologies Holding Corporation (GTEC) - Five Forces de Porter: Pouvoir de négociation des fournisseurs
Fabricants spécialisés d'équipement de manutention des matériaux
Depuis le quatrième trimestre 2023, GTEC s'approvisionne en composants d'environ 7 à 9 fabricants spécialisés dans le monde. Le marché des composants de machines industriels démontre un rapport de concentration de 65 à 70% parmi les fournisseurs de haut niveau.
| Catégorie des fournisseurs | Nombre de fournisseurs mondiaux | Concentration du marché |
|---|---|---|
| Composants de chariot électrique | 5-7 fabricants | 58% |
| Pièces de véhicules industriels | 4-6 fabricants | 62% |
Dépendances de l'alimentation des composants clés
La chaîne d'approvisionnement de GTEC révèle une dépendance modérée des fournisseurs de composants clés, avec environ 42% des composants critiques provenant de trois fabricants principaux.
- Fournisseurs de batterie au lithium-ion: 3 fabricants primaires
- Fournisseurs de composants de moteur électrique: 4 fournisseurs spécialisés
- Fabricants de systèmes hydrauliques: 2-3 fournisseurs mondiaux
Contraintes de chaîne d'approvisionnement
Les complexités mondiales de fabrication ont un impact sur la chaîne d'approvisionnement de GTEC avec les mesures suivantes:
| Métrique de la chaîne d'approvisionnement | Performance de 2023 |
|---|---|
| Délai de livraison de composant | 8-12 semaines |
| Risque de perturbation de la chaîne d'approvisionnement | 37% |
| Diversité géographique du fournisseur | 4 pays |
Analyse de la concentration des fournisseurs
Paysage des composants de chariot élévateur électriques et des composants de véhicules industriels:
- Les 3 meilleurs fournisseurs contrôlent 68% du marché des composants critiques
- Coût moyen de commutation du fournisseur: 475 000 $ - 625 000 $
- Marge de négociation des prix du fournisseur: 12-15%
Groenland Technologies Holding Corporation (GTEC) - Five Forces de Porter: Pouvoir de négociation des clients
Concentration de clientèle
Depuis le troisième trimestre 2023, la clientèle de GTEC était concentrée dans les secteurs de l'industrie et des matériaux, avec 67,3% des revenus provenant des ventes d'équipements de manutention.
| Segment de clientèle | Pourcentage de revenus |
|---|---|
| Manipulation des matériaux industriels | 67.3% |
| Équipement d'entrepôt | 22.5% |
| Autres secteurs | 10.2% |
Analyse de la sensibilité aux prix
Sur le marché des équipements compétitifs de matériaux, la sensibilité aux prix est importante. La tarification moyenne de l'équipement de GTEC varie de 15 000 $ à 250 000 $ selon la complexité.
Options de commutation du client
- 4-5 concurrents majeurs sur le marché des équipements de manutention des matériaux
- Coûts de commutation estimés entre 12 et 18% de la valeur de l'équipement
- Cycle de vie moyen de l'équipement: 7-10 ans
Coût total des considérations de propriété
| Composant coût | Pourcentage du coût total de propriété |
|---|---|
| Achat d'équipement initial | 35% |
| Entretien | 25% |
| Dépenses opérationnelles | 20% |
| Consommation d'énergie | 15% |
| Entraînement | 5% |
Les rapports financiers de GTEC 2023 indiquent un taux de rétention de la clientèle de 82,4% dans les segments d'équipement industriel.
Groenland Technologies Holding Corporation (GTEC) - Five Forces de Porter: Rivalry compétitif
Paysage de concurrence du marché
Au quatrième trimestre 2023, le marché mondial des équipements de manutention des matériaux était évalué à 132,5 milliards de dollars, avec un segment de chariot élévateur électrique représentant 24,3% de la part de marché totale.
| Concurrent | Part de marché (%) | Revenus annuels ($ m) |
|---|---|---|
| Toyota Industries | 15.7 | 9,845 |
| Kion | 12.3 | 8,212 |
| Mitsubishi logisnext | 10.5 | 7,456 |
| Groenland Technologies | 3.2 | 87.4 |
Dynamique compétitive
GTEC fait face à une concurrence intense avec plusieurs acteurs établis dans le chariot élévateur électrique et les segments de véhicules industriels.
- Nombre de concurrents directs: 12 fabricants mondiaux
- Concurrents régionaux: 37 producteurs régionaux de véhicules industriels
- Indice de fragmentation du marché: 0,64 (modéré)
Métriques d'innovation technologique
Investissement en R&D dans le secteur des équipements de manutention des matériaux pour 2023:
| Entreprise | Dépenses de R&D ($ m) | Brevets déposés |
|---|---|---|
| Toyota Industries | 412 | 87 |
| Kion | 328 | 62 |
| Groenland Technologies | 6.2 | 11 |
Analyse de la concentration du marché
Indice Herfindahl-Hirschman (HHI) pour le marché des équipements de manutention: 1 287 (modérément concentré).
- Les 4 principaux fabricants contrôlent 51,2% du marché mondial
- Barrières à l'entrée du marché moyen: élevé
- Potentiel de différenciation des produits: modéré
Greenland Technologies Holding Corporation (GTEC) - Five Forces de Porter: Menace de substituts
Technologies émergentes de manutention des matériaux
En 2024, le marché mondial des véhicules guidés automatisés (AGV) est évalué à 2,8 milliards de dollars, avec un TCAC projeté de 14,3% de 2023 à 2030. Les principaux acteurs du marché comprennent:
| Entreprise | Part de marché | AGV Revenue |
|---|---|---|
| Kion | 18.5% | 520 millions de dollars |
| Dématique | 15.7% | 442 millions de dollars |
| Solutions Rocla Agv | 12.3% | 345 millions de dollars |
Perturbation technologique des solutions autonomes
Statistiques du marché des équipements autonomes:
- Marché mondial des robots mobiles autonomes: 3,1 milliards de dollars en 2023
- Taille du marché attendu d'ici 2027: 8,4 milliards de dollars
- Taux de croissance annuel composé: 22,5%
Systèmes robotiques dans les opérations d'entrepôt
Adoption de la robotique en logistique:
| Année | Pénétration de la robotique de l'entrepôt | Investissement |
|---|---|---|
| 2022 | 12.4% | 4,7 milliards de dollars |
| 2024 | 18.6% | 6,3 milliards de dollars |
Alternatives de transport durable
Informations sur le marché des équipements de manutention électrique:
- Valeur marchande en 2023: 24,5 milliards de dollars
- Taille du marché prévu d'ici 2030: 45,3 milliards de dollars
- Part de marché électrique du chariot élévateur: 62% des ventes de nouveaux équipements
Groenland Technologies Holding Corporation (GTEC) - Five Forces de Porter: Menace de nouveaux entrants
Exigences de capital élevé pour la fabrication d'équipements industriels
Groenland Technologies nécessite un investissement initial substantiel pour la fabrication d'équipements industriels. En 2023, la société a déclaré un actif total d'équipement de fabrication de 12,3 millions de dollars.
| Catégorie d'investissement en capital | Montant ($) |
|---|---|
| Équipement de fabrication | 12,300,000 |
| Recherche & Développement | 3,750,000 |
| Installations de production | 8,500,000 |
Des obstacles technologiques importants à l'entrée
Le secteur spécialisé de la manutention des matériaux de GTEC présente des défis technologiques complexes pour les nouveaux entrants potentiels.
- Capacités d'ingénierie avancée requises
- Processus de fabrication spécialisés
- Expertise en technologie complexe des matériaux
Exigences de réputation et d'ingénierie de la marque établie
Le rapport financier de GTEC 2023 indique 47,6 millions de dollars de revenus, démontrant la crédibilité du marché.
| Métrique de performance de la marque | Valeur |
|---|---|
| Revenu total (2023) | 47,600,000 |
| Part de marché | 5.2% |
| Brevets d'ingénierie | 12 |
Défis de conformité et de certification réglementaires
L'équipement de manutention nécessite une conformité réglementaire stricte dans plusieurs juridictions.
- ISO 9001: Exigences de certification 2015
- Conformité des normes de sécurité internationales
- Règlements complexes sur les équipements industriels
Greenland Technologies Holding Corporation (GTEC) - Porter's Five Forces: Competitive rivalry
You're looking at the competitive rivalry in the drivetrain and electric industrial vehicle space, and honestly, it's a pressure cooker. Greenland Technologies Holding Corporation (GTEC) is definitely feeling the heat from global giants like ZF and BorgWarner in the core drivetrain segment. This intense horizontal competition explains some of the recent financial choppiness you see in the numbers.
Consider the contrast in GTEC's recent quarters in fiscal year 2025. After posting a net loss of $-2.76 million in Q2 2025 on revenue of $21.72 million, the company managed a significant bounce-back in Q3 2025, reporting net income of $5.73 million on sales of $23.4 million. That swing shows how quickly market dynamics-including competitive pricing or demand shifts-can impact a smaller player like GTEC.
The opportunity, though, is the market itself. The electric industrial vehicle segment is projected to grow at a 24% CAGR from 2025-2032. Still, this growth attracts heavyweights. Major construction equipment manufacturers, like Volvo, are actively entering the electric segment, bringing deep pockets and established distribution networks to the fight. This means GTEC can't just rely on its technology; it needs scale and defense.
Here's a quick look at how GTEC's recent performance stacks up against its major manufacturing partner, Lonking, to show the scale GTEC is operating within:
| Metric | Greenland Technologies Holding Corporation (GTEC) | Lonking Holdings (Latest Reported Data) |
|---|---|---|
| Latest Quarterly Revenue (Q3 2025) | $23.4 million | N/A (2024 Annual Revenue: RMB 10,213,556,000) |
| Latest Quarterly Net Income (Q3 2025) | $5.73 million | N/A (2024 Profit Before Tax: RMB 1,217,182,000) |
| Market Capitalization (Approx. Q1 2025) | Between $17.13 million and $31.68 million (Micro Cap) | Approximately $1B (as of March 2025) |
| Trailing EPS (as of Nov 2025) | $0.98 | RMB 0.24 (2024 EPS) |
GTEC's partnership with Lonking, a manufacturer with 2024 revenue in the billions of RMB, is a defintely strategic defense against these rivals. It helps GTEC secure volume and provides a crucial channel into the broader industrial equipment market, offsetting the threat from larger, more diversified competitors. The focus on operational discipline, evidenced by reducing Q1 2025 operating expenses by 50.2% to $1.85 million, is a necessary tactic when facing giants.
The competitive rivalry forces GTEC to focus on differentiation and efficiency, which is reflected in its margin improvement:
- Gross margin expanded by 580 basis points to 30.7% in Q1 2025.
- The company's Q3 2025 performance showed a strong rebound from its Q2 $-2.76 million loss.
- GTEC's low trailing P/E ratio of 1.11 suggests the market is pricing in future earnings volatility or competitive risk.
- The company is focused on its electric industrial vehicle segment, HEVI Corp., to capture growth.
You need to watch their capital allocation closely; maintaining liquidity, like the $5.40 million in cash and equivalents as of March 31, 2025, is key to weathering competitive price wars.
Greenland Technologies Holding Corporation (GTEC) - Porter's Five Forces: Threat of substitutes
You're looking at the competition Greenland Technologies Holding Corporation (GTEC) faces from alternatives to its electric industrial vehicle offerings. The primary substitute remains the traditional diesel or internal combustion engine (ICE) industrial vehicle. Honestly, the threat here is high because, as of late 2025, these ICE alternatives generally carry a lower initial purchase price. For instance, in 2024, the upfront cost of a battery electric truck was still two to three times that of a diesel equivalent. This initial sticker shock is a major hurdle, especially when you consider that small businesses make up about 95% of hauliers in the United States.
Still, this threat is being actively mitigated by a global regulatory push. Substitution pressure is definitely easing because environmental regulations are getting tighter everywhere. For example, Europe is targeting a ban on new ICE vehicle sales by 2035, and over 25 countries have pledged similar phase-outs between 2035 and 2040. Furthermore, policies like CO2-based road tolls, such as the EuroVignette directive, directly increase the long-term Total Cost of Ownership (TCO) for high-emission diesel equipment, making GTEC's electric focus more appealing over time. China, for instance, remains a leader, accounting for over 60% of global EV sales in 2024, driven by strong industrial policy.
The long-term financial argument for electric vehicles is clear: they offer a significant TCO advantage. Electric vehicles are about 55% more energy-efficient than their diesel counterparts. This translates directly to the pump-or in this case, the plug. In markets like China, energy costs for battery electric trucks are already over 50% lower per kilometer than diesel, with direct fuel savings approaching 70% based on 2024 prices. Plus, the maintenance side is leaner; electric commercial vehicles can see maintenance costs drop by up to 50% because they lack complex systems like oil changes or exhaust components. Here's the quick math: even with higher initial costs, studies show that these lower operating expenses typically amortize the premium within 4 to 6 years.
To give you a clearer picture of where the costs break down, look at this TCO comparison for heavy-duty segments as of late 2025:
| TCO Component | Diesel/ICE Vehicle (Reference) | Battery Electric Vehicle (BEV) |
|---|---|---|
| Initial Purchase Cost (2024 Est.) | Baseline (Lower) | 2x to 3x Baseline (Higher) |
| Energy/Fuel Cost per Kilometer (China Est.) | Baseline | 30% of Diesel Cost (Approx. 70% lower) |
| Energy Efficiency (Tank-to-Wheel) | Reference | Up to 55% better than Diesel |
| Maintenance & Repair Costs | Baseline | Up to 50% lower |
| Upfront Cost as % of Total TCO (Est.) | Higher Percentage | About 20-25% of Total TCO |
What this estimate hides is that for GTEC, which reported Q3 2025 revenue of $23.4 million and a gross margin of 30.7% in Q1 2025, the immediate sales cycle is still sensitive to the initial price gap. Customer adoption is still definitely hindered by practical concerns. You hear it all the time: worries about the availability and reliability of charging infrastructure remain a sticking point, especially for fleets that need high utilization. Also, while battery life is improving, residual value concerns tied to battery degradation persist in the minds of fleet managers, even though GTEC's focus on drivetrain systems and HEVI Corp. is meant to address the electric industrial vehicle segment directly. Finance: draft 13-week cash view by Friday.
Greenland Technologies Holding Corporation (GTEC) - Porter's Five Forces: Threat of new entrants
You're looking at the barriers to entry for new competitors trying to muscle in on Greenland Technologies Holding Corporation (GTEC)'s turf, specifically in drivetrain systems for material handling and electric vehicles. Honestly, the landscape is a mix of very high walls and some surprisingly low gates, depending on where you look.
High capital expenditure and R&D costs for battery and drivetrain technology create a barrier
Building out the necessary manufacturing footprint for advanced drivetrains and battery integration requires serious upfront cash. While GTEC reported capital expenditures of -$813,395 over the last twelve months, a new, large-scale entrant would face CapEx figures orders of magnitude higher to compete on volume. For context in the broader EV space, incumbent manufacturers are ramping up massive investments; for instance, in 2024, one major player expected its CapEx to be between USD 1.6 billion and USD 1.8 billion. Furthermore, the underlying technology cost remains substantial; in the EU, battery costs were estimated to be around 34% of a compact Battery Electric Vehicle's (BEV) direct costs in 2025, down from 40% in 2020. This high initial outlay and ongoing technology development spend definitely keeps the casual competitor out.
Government incentives and a fast-growing market actively lower the financial barrier for new players
Still, the market's growth trajectory and government support act as a magnet, potentially offsetting some of that initial capital hurdle for well-funded entrants. In the US, investor commitments to EV and battery production, spurred by legislation, topped $312 billion. This signals significant available capital flowing into the ecosystem. While the US federal Clean Vehicle Credit, which offered up to $7,500, ended for vehicles acquired after September 30, 2025, state and local incentives persist, and the overall market is expanding. For example, the European vehicle electrification market was valued at USD 7.10 billion in 2024 and projected to hit USD 7.72 billion in 2025. In the UK, the government extended its Electric Car Grant with an additional £1.3 billion in funding until 2029-30. These incentives help new players manage the initial cost of adoption for their customers.
The industry trend toward integrated power train solutions creates opportunity for specialized new entrants
The shift in the industry is not just about making batteries; it's about integrating them seamlessly with the drivetrain-exactly GTEC's core business. New entrants can focus on a niche, specialized component or a superior integration method, bypassing the need to build out the entire vertical stack that an incumbent like GTEC might have. The market is seeing a push for integrated solutions, which means a specialized firm with novel software or a unique mechanical design for the power train assembly could find a faster path to market than one trying to compete across the board. This is where agility beats sheer scale, at least initially.
GTEC's established expertise in transmission systems offers a proprietary technology defense
GTEC's defense rests on its history. The company develops and manufactures drivetrain systems for material handling machinery and electric industrial vehicles. This established expertise in transmission systems, particularly for industrial applications, acts as a moat. While specific R&D spending figures for GTEC were reported as decreasing in Q1 2025 to $1.85 million in total operating expenses, the accumulated intellectual property and operational know-how in this specific segment are not easily replicated. Furthermore, GTEC's financial position as of Q3 2025 shows a decrease in total liabilities to $53.6 million from $62.3 million, suggesting a relatively lower debt load compared to some capital-intensive rivals. The company's focus on higher-value products has also led to a gross margin of 30.7% in Q3 2025, indicating pricing power derived from its established product quality.
Here's a quick look at some relevant financial and market figures:
| Metric | Value/Amount (Latest Available) | Context/Period |
|---|---|---|
| US EV/Battery Investment Committed | $312 billion | Spurred by US Incentives (IRA/IIJA) |
| GTEC Q3 2025 Revenue | $23.4 million | Quarter ending September 30, 2025 |
| European Vehicle Electrification Market Value | USD 7.72 billion | Projected for 2025 |
| GTEC Capital Expenditures (Last 12 Months) | -$813,395 | Trailing Twelve Months |
| GTEC Short-Term Investments | $29.1 million | As of September 30, 2025 |
| GTEC Q3 2025 Gross Profit Margin | 30.7% | Quarter ending September 30, 2025 |
The threat is real, but it's fragmented; new entrants face massive CapEx hurdles but are tempted by government-backed market growth and the opportunity to specialize in the integrated power train niche. Finance: draft 13-week cash view by Friday.
Disclaimer
All information, articles, and product details provided on this website are for general informational and educational purposes only. We do not claim any ownership over, nor do we intend to infringe upon, any trademarks, copyrights, logos, brand names, or other intellectual property mentioned or depicted on this site. Such intellectual property remains the property of its respective owners, and any references here are made solely for identification or informational purposes, without implying any affiliation, endorsement, or partnership.
We make no representations or warranties, express or implied, regarding the accuracy, completeness, or suitability of any content or products presented. Nothing on this website should be construed as legal, tax, investment, financial, medical, or other professional advice. In addition, no part of this site—including articles or product references—constitutes a solicitation, recommendation, endorsement, advertisement, or offer to buy or sell any securities, franchises, or other financial instruments, particularly in jurisdictions where such activity would be unlawful.
All content is of a general nature and may not address the specific circumstances of any individual or entity. It is not a substitute for professional advice or services. Any actions you take based on the information provided here are strictly at your own risk. You accept full responsibility for any decisions or outcomes arising from your use of this website and agree to release us from any liability in connection with your use of, or reliance upon, the content or products found herein.