
|
ESS Tech, Inc. (GWH) Évaluation DCF |
Entièrement Modifiable: Adapté À Vos Besoins Dans Excel Ou Sheets
Conception Professionnelle: Modèles Fiables Et Conformes Aux Normes Du Secteur
Pré-Construits Pour Une Utilisation Rapide Et Efficace
Compatible MAC/PC, entièrement débloqué
Aucune Expertise N'Est Requise; Facile À Suivre
ESS Tech, Inc. (GWH) Bundle
Découvrez le véritable potentiel de ESS Tech, Inc. (GWH) avec notre calculatrice avancée DCF! Ajustez les hypothèses critiques, explorez divers scénarios et évaluez comment les modifications affectent ESS Tech, Inc. (GWH) - toutes commodément dans un modèle Excel.
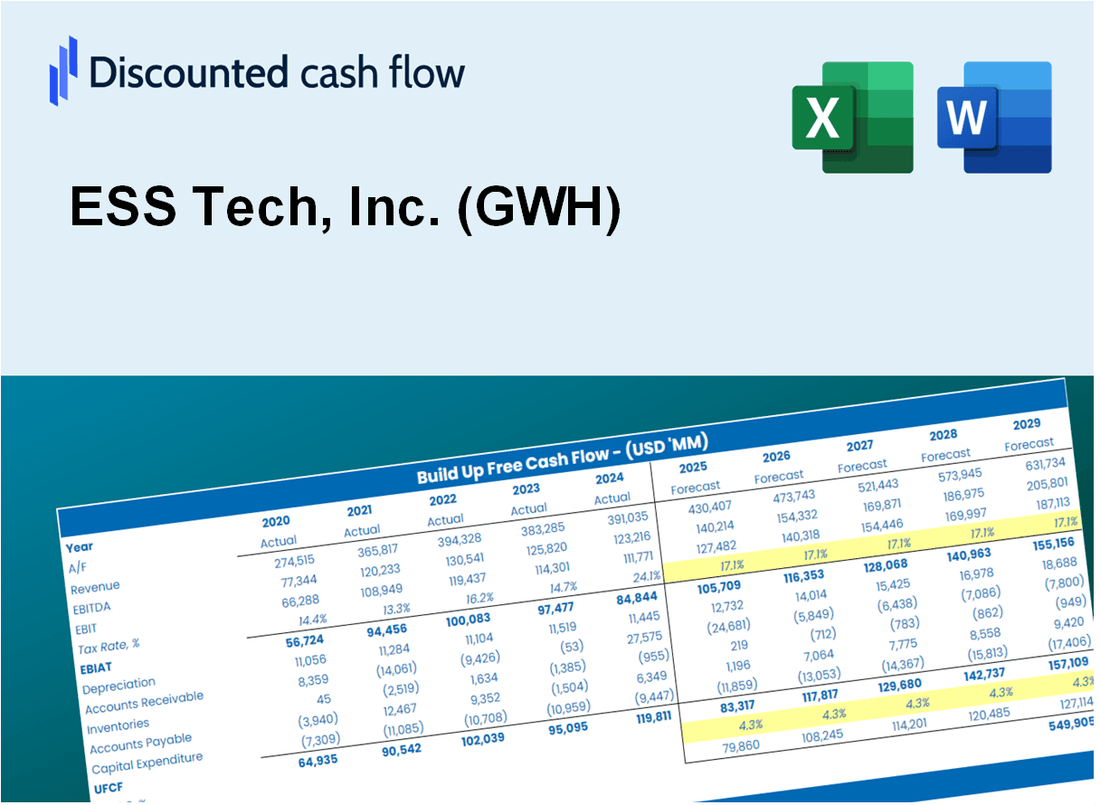
Discounted Cash Flow (DCF) - (USD MM)
| Year | AY1 2020 |
AY2 2021 |
AY3 2022 |
AY4 2023 |
AY5 2024 |
FY1 2025 |
FY2 2026 |
FY3 2027 |
FY4 2028 |
FY5 2029 |
|---|---|---|---|---|---|---|---|---|---|---|
| Revenue | .0 | .0 | .9 | 7.5 | 6.3 | 7.6 | 9.2 | 11.1 | 13.4 | 16.2 |
| Revenue Growth, % | 0 | 0 | 0 | 743.4 | -16.51 | 20.87 | 20.87 | 20.87 | 20.87 | 20.87 |
| EBITDA | -17.0 | -60.0 | -104.0 | -79.4 | -85.1 | -1.5 | -1.8 | -2.2 | -2.7 | -3.2 |
| EBITDA, % | 100 | 100 | -11629.64 | -1052.94 | -1351.45 | -20 | -20 | -20 | -20 | -20 |
| Depreciation | .4 | .6 | 2.7 | 6.5 | 4.7 | 7.0 | 8.5 | 10.3 | 12.4 | 15.0 |
| Depreciation, % | 100 | 100 | 297.2 | 86.38 | 75.04 | 92.28 | 92.28 | 92.28 | 92.28 | 92.28 |
| EBIT | -17.4 | -60.6 | -106.6 | -85.9 | -89.8 | -1.5 | -1.8 | -2.2 | -2.7 | -3.2 |
| EBIT, % | 100 | 100 | -11926.85 | -1139.32 | -1426.5 | -20 | -20 | -20 | -20 | -20 |
| Total Cash | 4.9 | 238.9 | 139.8 | 108.1 | 31.6 | 7.6 | 9.2 | 11.1 | 13.4 | 16.2 |
| Total Cash, percent | .0 | .0 | .0 | .0 | .0 | .0 | .0 | .0 | .0 | .0 |
| Account Receivables | .0 | .5 | 5.0 | 2.2 | 2.4 | 5.6 | 6.8 | 8.2 | 9.9 | 12.0 |
| Account Receivables, % | 100 | 100 | 553.91 | 29.75 | 38.4 | 73.63 | 73.63 | 73.63 | 73.63 | 73.63 |
| Inventories | .0 | .7 | 1.2 | 3.4 | 5.6 | 6.6 | 8.0 | 9.7 | 11.7 | 14.1 |
| Inventories, % | 100 | 100 | 135.68 | 44.64 | 89.61 | 86.85 | 86.85 | 86.85 | 86.85 | 86.85 |
| Accounts Payable | .5 | 1.6 | 3.0 | 2.8 | 8.1 | 6.6 | 8.0 | 9.7 | 11.7 | 14.2 |
| Accounts Payable, % | 100 | 100 | 339.6 | 36.54 | 128.2 | 87.31 | 87.31 | 87.31 | 87.31 | 87.31 |
| Capital Expenditure | -.5 | -2.8 | -14.2 | -5.8 | -7.3 | -4.2 | -5.1 | -6.2 | -7.4 | -9.0 |
| Capital Expenditure, % | 100 | 100 | -1586.13 | -76.79 | -115.87 | -55.36 | -55.36 | -55.36 | -55.36 | -55.36 |
| Tax Rate, % | 0 | 0 | 0 | 0 | 0 | 0 | 0 | 0 | 0 | 0 |
| EBITAT | -17.4 | -41.2 | -106.6 | -85.9 | -89.8 | -1.4 | -1.7 | -2.1 | -2.5 | -3.0 |
| Depreciation | ||||||||||
| Changes in Account Receivables | ||||||||||
| Changes in Inventories | ||||||||||
| Changes in Accounts Payable | ||||||||||
| Capital Expenditure | ||||||||||
| UFCF | -17.0 | -43.6 | -121.6 | -84.9 | -89.5 | -4.2 | .5 | .6 | .7 | .9 |
| WACC, % | 9.54 | 9.54 | 9.54 | 9.54 | 9.54 | 9.54 | 9.54 | 9.54 | 9.54 | 9.54 |
| PV UFCF | ||||||||||
| SUM PV UFCF | -1.8 | |||||||||
| Long Term Growth Rate, % | 2.00 | |||||||||
| Free cash flow (T + 1) | 1 | |||||||||
| Terminal Value | 12 | |||||||||
| Present Terminal Value | 8 | |||||||||
| Enterprise Value | 6 | |||||||||
| Net Debt | -12 | |||||||||
| Equity Value | 18 | |||||||||
| Diluted Shares Outstanding, MM | 177 | |||||||||
| Equity Value Per Share | 0.10 |
What You Will Receive
- Customizable Excel Template: A fully adjustable Excel-based DCF Calculator featuring pre-filled financials for ESS Tech, Inc. (GWH).
- Accurate Data: Historical performance metrics and forward-looking projections (highlighted in the yellow cells).
- Flexible Forecasting: Modify key assumptions such as revenue growth, EBITDA %, and WACC.
- Instant Calculations: Quickly observe how your inputs affect the valuation of ESS Tech, Inc. (GWH).
- Professional Resource: Designed for investors, CFOs, consultants, and financial analysts.
- Intuitive Layout: Organized for clarity and ease of navigation, complete with step-by-step guidance.
Key Features
- 🔍 Real-Life GWH Financials: Pre-filled historical and projected data for ESS Tech, Inc. (GWH).
- ✏️ Fully Customizable Inputs: Adjust all critical parameters (yellow cells) such as WACC, growth %, and tax rates.
- 📊 Professional DCF Valuation: Built-in formulas calculate ESS Tech’s intrinsic value using the Discounted Cash Flow method.
- ⚡ Instant Results: Visualize ESS Tech’s valuation instantly after making changes.
- Scenario Analysis: Test and compare outcomes for various financial assumptions side-by-side.
How It Works
- Step 1: Download the Excel file for ESS Tech, Inc. (GWH).
- Step 2: Review ESS Tech's pre-filled financial data and forecasts.
- Step 3: Modify key inputs such as revenue growth, WACC, and tax rates (highlighted cells).
- Step 4: Observe the DCF model update in real-time as you adjust assumptions.
- Step 5: Analyze the results and leverage them for informed investment decisions.
Why Choose the ESS Tech, Inc. (GWH) Calculator?
- Accuracy: Utilizes real ESS Tech financial data for precise calculations.
- Flexibility: Allows users to easily adjust and test various input parameters.
- Time-Saving: Eliminate the need to create a DCF model from the ground up.
- Professional-Grade: Crafted with the expertise and precision expected at the CFO level.
- User-Friendly: Intuitive design makes it accessible for users with varying financial backgrounds.
Who Should Use ESS Tech, Inc. (GWH)?
- Renewable Energy Students: Explore innovative technologies and apply them to real-world scenarios.
- Researchers: Integrate cutting-edge models into your studies on sustainable energy solutions.
- Investors: Validate your investment strategies and analyze the performance of ESS Tech, Inc. (GWH).
- Market Analysts: Enhance your analysis with a customizable model specific to the energy sector.
- Entrepreneurs: Understand how established companies like ESS Tech, Inc. (GWH) navigate the renewable energy market.
What the Template Contains
- Preloaded GWH Data: Historical and projected financial data, including revenue, EBIT, and capital expenditures.
- DCF and WACC Models: Professional-grade sheets for calculating intrinsic value and Weighted Average Cost of Capital.
- Editable Inputs: Yellow-highlighted cells for adjusting revenue growth, tax rates, and discount rates.
- Financial Statements: Comprehensive annual and quarterly financials for deeper analysis.
- Key Ratios: Profitability, leverage, and efficiency ratios to evaluate performance.
- Dashboard and Charts: Visual summaries of valuation outcomes and assumptions.
Disclaimer
All information, articles, and product details provided on this website are for general informational and educational purposes only. We do not claim any ownership over, nor do we intend to infringe upon, any trademarks, copyrights, logos, brand names, or other intellectual property mentioned or depicted on this site. Such intellectual property remains the property of its respective owners, and any references here are made solely for identification or informational purposes, without implying any affiliation, endorsement, or partnership.
We make no representations or warranties, express or implied, regarding the accuracy, completeness, or suitability of any content or products presented. Nothing on this website should be construed as legal, tax, investment, financial, medical, or other professional advice. In addition, no part of this site—including articles or product references—constitutes a solicitation, recommendation, endorsement, advertisement, or offer to buy or sell any securities, franchises, or other financial instruments, particularly in jurisdictions where such activity would be unlawful.
All content is of a general nature and may not address the specific circumstances of any individual or entity. It is not a substitute for professional advice or services. Any actions you take based on the information provided here are strictly at your own risk. You accept full responsibility for any decisions or outcomes arising from your use of this website and agree to release us from any liability in connection with your use of, or reliance upon, the content or products found herein.