
|
Hyatt Hotels Corporation (H): 5 Forces Analysis [Jan-2025 Mis à jour] |
Entièrement Modifiable: Adapté À Vos Besoins Dans Excel Ou Sheets
Conception Professionnelle: Modèles Fiables Et Conformes Aux Normes Du Secteur
Pré-Construits Pour Une Utilisation Rapide Et Efficace
Compatible MAC/PC, entièrement débloqué
Aucune Expertise N'Est Requise; Facile À Suivre
Hyatt Hotels Corporation (H) Bundle
Dans le paysage dynamique de l'hospitalité mondiale, Hyatt Hotels Corporation navigue dans un réseau complexe de forces compétitives qui façonnent ses décisions stratégiques et le positionnement du marché. Au fur et à mesure que les préférences des voyageurs évoluent et que la technologie transforme l'industrie, la compréhension de la dynamique complexe de la puissance des fournisseurs, des attentes des clients, des pressions concurrentielles, des substituts potentiels et des obstacles à l'entrée devient crucial pour un succès soutenu. Cette plongée profonde dans le cadre des cinq forces de Porter révèle les défis stratégiques et les opportunités qui définissent l'écosystème compétitif de Hyatt en 2024, offrant un aperçu de la façon dont l'entreprise maintient son avantage concurrentiel dans un marché de l'hospitalité de plus en plus volatile.
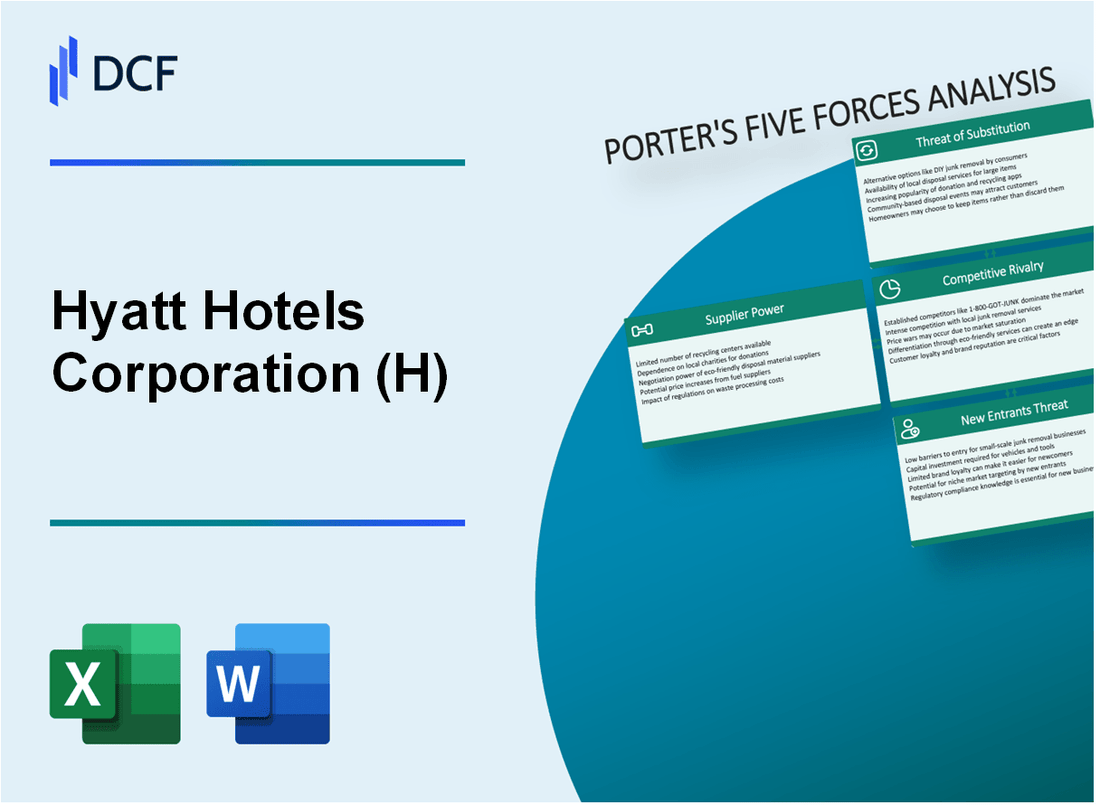
Hyatt Hotels Corporation (H) - Five Forces de Porter: Pouvoir de négociation des fournisseurs
Nombre limité de grands équipements hôteliers et fournisseurs d'ameublement
En 2024, Hyatt Hotels Corporation identifie environ 7 à 10 principaux fournisseurs mondiaux pour l'équipement et le mobilier de l'hôtel. La valeur marchande totale pour les meubles et l'équipement hôteliers est estimé à 32,5 milliards de dollars.
| Catégorie des fournisseurs | Nombre de principaux fournisseurs | Part de marché estimé |
|---|---|---|
| Fabricants de meubles | 4 | 62% |
| Fournisseurs d'équipements de cuisine | 3 | 48% |
| Systèmes de technologie hôtelière | 5 | 55% |
Réseaux mondiaux de distribution des aliments et des boissons
Hyatt s'appuie sur 12 réseaux de distribution mondiale de produits alimentaires et de boissons primaires, avec Sysco Corporation et les aliments américains contrôlant environ 76% du marché commercial de la distribution des aliments.
- Budget annuel de l'approvisionnement alimentaire: 487 millions de dollars
- Nombre de fournisseurs d'aliments mondiaux: 42
- Pourcentage d'ingrédients d'origine locale: 31%
Systèmes de technologie hôtelière spécialisée
Le marché des systèmes de technologie hôtelière est concentré, 5 fournisseurs majeurs contrôlant 68% du marché. Les dépenses totales de l'approvisionnement en technologie pour Hyatt en 2023 étaient de 124 millions de dollars.
| Fournisseur de technologie | Part de marché | Systèmes clés fournis |
|---|---|---|
| Hospitalité Oracle | 28% | Systèmes de gestion immobilière |
| Faire de | 22% | Logiciel d'entreprise |
| Amadeus | 18% | Systèmes de réservation |
Pouvoir de négociation des fournisseurs
La présence mondiale de Hyatt de 1 150 hôtels dans 68 pays offre un effet de levier de négociation important. Le chiffre d'affaires annuel de 6,8 milliards de dollars de la société en 2023 permet de solides postes de négociation auprès des fournisseurs.
- Durée du contrat moyen des fournisseurs: 3-5 ans
- Couverture du programme de diversité des fournisseurs: 42%
- Économies de coûts négociés en 2023: 76 millions de dollars
Hyatt Hotels Corporation (H) - Five Forces de Porter: Pouvoir de négociation des clients
Sensibilité élevée au prix du client sur le marché de l'hôtellerie concurrentiel
En 2023, le taux quotidien moyen de Hyatt (ADR) était de 210,48 $, contre 214,31 $ de Marriott et de 206,75 $ de Hilton. La sensibilité au prix du client est évidente à travers les données suivantes:
| Métrique | Valeur |
|---|---|
| Élasticité du prix du client dans l'hospitalité | Plage 1.4-1.6 |
| Pourcentage de clients comparant les prix de l'hôtel | 78% |
| Sensibilité à la réduction moyenne | 15-20% |
Solide préférence des consommateurs pour le programme de fidélité
Statistiques du programme de fidélité World of Hyatt:
- Total des membres: 2,1 millions au quatrième trimestre 2023
- Taux de réservation répétée: 42%
- Points moyens rachat par membre: 6 500 points
Divers segments de clients
| Segment de clientèle | Pourcentage |
|---|---|
| Voyageurs d'affaires | 37% |
| Voyageurs de loisir | 48% |
| Voyageurs de groupe / conférence | 15% |
Augmentation des attentes des clients
Taux d'adoption des services numériques:
- Utilisation d'enregistrement mobile: 65%
- Utilisation des clés de la salle numérique: 52%
- Acceptation de recommandation personnalisée: 47%
Hyatt Hotels Corporation (H) - Five Forces de Porter: rivalité compétitive
Paysage compétitif Overview
En 2024, Hyatt Hotels Corporation fait face à une concurrence intense sur le marché mondial de l'hôtellerie. Le paysage concurrentiel comprend des acteurs clés avec une présence importante sur le marché:
| Concurrent | Chambres d'hôtel mondiales | Revenus annuels (2023) |
|---|---|---|
| Marriott International | 1 421 807 chambres | 22,4 milliards de dollars |
| Hilton dans le monde | 1 041 000 chambres | 9,9 milliards de dollars |
| Group des hôtels intercontinentaux (IHG) | 883 000 chambres | 6,1 milliards de dollars |
| Hyatt Hotels Corporation | 135 000 chambres | 4,45 milliards de dollars |
Analyse de la fragmentation du marché
L'industrie hôtelière mondiale démontre une fragmentation significative du marché:
- Les 5 meilleures chaînes d'hôtel contrôlent environ 31% des chambres d'hôtel mondiales
- 69% restants répartis entre les petites marques hôtelières régionales et indépendantes
- Marché hôtelier mondial estimé à 5,81 billions de dollars en 2023
Pressions et innovation concurrentielles
L'investissement technologique et les stratégies concurrentielles mettent en évidence la dynamique du marché:
- Investissement annuel moyen de la R&D dans la technologie hôtelière: 87 millions de dollars par grande chaîne hôtelière
- Les dépenses de transformation numérique devraient atteindre 12,3 milliards de dollars de secteur hôtelier d'ici 2025
- Expérience client Les investissements technologiques augmentant de 15,4% par an
Métriques de différenciation de la marque
| Facteur de différenciation de la marque | Niveau d'investissement |
|---|---|
| Développement d'expérience client unique | 45,6 millions de dollars |
| Amélioration du service numérique | 32,2 millions de dollars |
| Technologie de personnalisation | 28,7 millions de dollars |
Hyatt Hotels Corporation (H) - Five Forces de Porter: menace de substituts
Popularité croissante des plateformes d'hébergement alternatives comme Airbnb
Airbnb a déclaré 7,4 millions d'annonces à l'échelle mondiale au quatrième trimestre 2023. En 2022, Airbnb a généré 8,4 milliards de dollars de revenus, ce qui représente une augmentation de 40% sur l'autre. La pénétration du marché de la plate-forme dans le secteur de l'hôtellerie a atteint 14,2% en 2023.
| Plate-forme | Listes mondiales | Revenus (2022) | Part de marché |
|---|---|---|---|
| Airbnb | 7,4 millions | 8,4 milliards de dollars | 14.2% |
Augmentation de la tendance du travail à distance impactant les voyages commerciaux
Les dépenses de voyage d'affaires en 2023 ont atteint 1,03 billion de dollars dans le monde, toujours à 20% de moins que les niveaux pré-pandemiques de 2019. L'adoption des travaux à distance est passée à 28% des jours de travail en 2023, ce qui concerne directement les modèles de voyage des entreprises.
- Dépenses de voyage en affaires: 1,03 billion de dollars
- Adoption du travail à distance: 28% des jours de travail
- Réduction des voyages d'entreprise: 20% en dessous des niveaux de 2019
Rise des plateformes de réservation numérique et des agences de voyage en ligne
Les agences de voyages en ligne (OTA) ont capturé 39% du total des réservations d'hôtels en 2023. Le groupe Expedia a généré 8,6 milliards de dollars de revenus, tandis que Booking Holdings a déclaré 11,2 milliards de dollars la même année.
| Plate-forme | Part de marché OTA | Revenus de 2023 |
|---|---|---|
| Groupe Expedia | 19% | 8,6 milliards de dollars |
| Booking Holdings | 20% | 11,2 milliards de dollars |
Émergence d'hôtels de boutique et d'expériences d'hébergement uniques
La taille du marché hôtelier de la boutique a atteint 18,4 milliards de dollars en 2023, augmentant à un taux de croissance annuel composé de 7,5%. Des expériences d'hébergement uniques représentaient 22% du total des réservations de voyages de loisirs en 2023.
- Boutique Hotel Market Taille: 18,4 milliards de dollars
- Taux de croissance du marché: 7,5% CAGR
- Réservations d'hébergement uniques: 22% des voyages de loisirs
Hyatt Hotels Corporation (H) - Five Forces de Porter: menace de nouveaux entrants
Exigences de capital initial élevées pour le développement des biens de l'hôtel
Hyatt Hotels Corporation fait face à des obstacles en capital importants avec des coûts de développement hôteliers allant de 150 000 $ à 1 000 000 $ par chambre. Les frais de construction de nouveaux hôtels moyens en 2023 étaient d'environ 22 millions de dollars par propriété.
| Catégorie d'investissement | Plage de coûts estimés |
|---|---|
| Acquisition de terres | 2 à 10 millions de dollars |
| Coûts de construction | 15-25 millions de dollars |
| Mobilier intérieur | 3 à 5 millions de dollars |
Environnement réglementaire complexe
La conformité réglementaire du secteur de l'hospitalité implique plusieurs couches de complexité.
- Les approbations de zonage coûtent entre 50 000 $ et 250 000 $
- Les évaluations d'impact environnemental varient de 75 000 $ à 300 000 $
- Frais de permis de construire en moyenne 100 000 $ à 500 000 $
Barrières de reconnaissance de la marque
La valeur de la marque de Hyatt est estimée à 4,2 milliards de dollars en 2023, créant des défis d'entrée du marché substantiels.
| Métrique de la marque | Valeur |
|---|---|
| Évaluation de la marque | 4,2 milliards de dollars |
| Compte d'hôtel mondial | 1 150 propriétés |
| Prime de marque moyenne | 15-25% |
Économies d'échelle
Échelle opérationnelle minimale pour le positionnement concurrentiel nécessite:
- Minimum 10 hôtels dans le portefeuille
- Revenus annuels dépassant 500 millions de dollars
- Taux d'occupation supérieurs à 65%
Hyatt Hotels Corporation (H) - Porter's Five Forces: Competitive rivalry
You're analyzing the competitive intensity in the lodging sector, and for Hyatt Hotels Corporation (H), the rivalry is definitely fierce. This force is arguably the most significant pressure point for Hyatt, given the scale and market presence of its primary global rivals. The industry structure dictates that price competition and service parity are constant threats, making differentiation through brand experience critical for maintaining pricing power.
The rivalry is intense with giants like Marriott International, which reported trailing twelve months (TTM) revenue of $25.92 Billion USD as of September 30, 2025. Hilton Worldwide, another major competitor, is also a significant force, with a suggested revenue figure around $11.73B for the same period, though recent quarterly reports show Q3 2025 revenue at $3.12 billion. Comparing these figures helps frame the scale difference Hyatt operates within.
Hyatt's strategic focus on the luxury and all-inclusive segments is its primary countermeasure to this rivalry. This strategy was significantly bolstered by the acquisition of Playa Hotels & Resorts N.V. for approximately $2.6 billion, which included about $900 million in debt, net of cash. This move is designed to create differentiation by deepening expertise and scale in high-yield leisure markets, specifically in the Caribbean and Mexico, where development opportunities are constrained.
To illustrate the competitive positioning based on scale and growth ambition, here is a snapshot of the competitive landscape:
| Competitor | Suggested 2025 Revenue (USD) | Reported/Projected 2025 Net Rooms Growth | Pipeline Size (Rooms) |
|---|---|---|---|
| Marriott International | $25.92B | Not explicitly stated for 2025 | 3900 properties in pipeline |
| Hilton Worldwide | $11.73B | Projected 6.5% to 7% NUG (Net Unit Growth) | Approximately 510,600 rooms as of June 30, 2025 |
| Hyatt Hotels Corporation (H) | (Not explicitly stated for full year 2025) | Projected 6% to 7% Net Rooms Growth | Approximately 141,000 rooms |
The overall industry growth rate, while still positive, suggests a moderate environment, which naturally heightens the importance of stealing share. For full-year 2025, Hyatt is projecting comparable Revenue Per Available Room (RevPAR) growth of 2% to 2.5%. This moderate growth projection means that success hinges on capturing demand from competitors rather than just riding a rising tide. Competitors often match service offerings quickly, so the brand experience and location become the critical differentiators you need to watch.
Hyatt's pipeline signals an aggressive, ongoing pursuit of market share, which is a direct response to the competitive environment. This pipeline, stated as approximately 141,000 rooms, shows a clear commitment to expanding brand footprint where they see demand for their specific segments.
The strategic actions Hyatt is taking to manage this rivalry include:
- Focusing on asset-light growth, aiming for over 90% asset-light earnings by the end of 2027.
- Leveraging the Playa acquisition to add 24 resorts (8,627 rooms) in key leisure markets.
- Targeting strong growth in the luxury and lifestyle segments, which showed resilience.
- Anticipating at least $2 billion in proceeds from asset sales post-Playa close to maintain its investment-grade profile.
Finance: draft 13-week cash view by Friday.
Hyatt Hotels Corporation (H) - Porter's Five Forces: Threat of substitutes
You're assessing the competitive landscape for Hyatt Hotels Corporation (H) as of late 2025, and the threat from substitutes is definitely a major factor you need to model. Substitutes are different products or services that fulfill the same core customer need-in this case, temporary lodging and meeting space-but come from outside the traditional hotel industry. This force is elevated because the cost to switch is often negligible.
Short-term rental platforms like Airbnb pose a significant threat, generating around $10 billion in 2024 revenue. To be fair, the actual 2024 revenue for Airbnb was reported at $11.102 billion, showing the scale of this alternative accommodation sector. Furthermore, the TTM revenue ending September 30, 2025, reached $11.943 billion, indicating continued growth in this substitute category.
Business travel demand is reduced by the continued adoption of video conferencing technology. This shift has made virtual meetings a core business tool, with significant cost implications for corporate travel budgets. For example, firms adopting these tools report cutting travel and lodging costs by as much as 30%-40%. In organizations that heavily use video conferencing, the need for business travel can be reduced by up to 47%. The market for this substitute technology itself is booming; the global video conferencing market is projected to grow from $11.6531 billion in 2024 to $13.0655 billion in 2025. This trend is supported by workforce changes, as over 32.6 million Americans, or about 22% of the US workforce, are working remotely as of 2025.
Extended-stay and boutique alternatives offer unique, lower-cost lodging options. These segments directly compete for the traveler who needs more space than a standard room or a more localized experience than a large chain hotel. Hyatt is actively countering this by expanding its own brand portfolio to capture these segments. The cost for a customer to switch to a substitute is essentially zero; a traveler can book a short-term rental or a boutique hotel with minimal friction compared to booking a Hyatt property.
Hyatt counters this with its own extended-stay brand, Hyatt Studios. The company opened its first Hyatt Studios in Mobile, Alabama, earlier in 2025, signaling a direct response to the demand for longer-stay, potentially lower-cost formats. This strategy is part of a broader expansion effort, as Hyatt reported a 10.5% net rooms growth in Q1 2025. However, the overall environment is mixed, with Hyatt's full-year 2025 RevPAR growth guidance revised to a modest range of 1% to 3%, though net rooms growth guidance remains solid at 6% to 7%.
Here's a quick look at the scale of the substitute pressure and Hyatt's response:
| Substitute Category | Key Metric | Associated Value (Latest Available) |
|---|---|---|
| Short-Term Rentals (Airbnb) | 2024 Annual Revenue | $11.102 billion |
| Video Conferencing | Projected 2025 Market Value | $13.0655 billion |
| Video Conferencing Impact | Max Business Travel Cost Reduction | 47% |
| Remote Workforce (US) | Estimated Remote Workers in 2025 | 32.6 million people |
| Hyatt Response | Q1 2025 Net Rooms Growth | 10.5% |
The primary ways these substitutes exert pressure on Hyatt include:
- Directly capturing leisure and small group bookings.
- Permanently eroding a portion of corporate travel spend.
- Offering differentiated, often more residential, experiences.
- Creating a low-barrier-to-entry alternative for price-sensitive travelers.
The success of Hyatt's new brands like Hyatt Studios will be key to mitigating this threat, especially in the mid-scale and extended-stay segments where substitutes are most aggressive. Finance: draft 13-week cash view by Friday.
Hyatt Hotels Corporation (H) - Porter's Five Forces: Threat of new entrants
The threat of new entrants for Hyatt Hotels Corporation remains relatively contained, primarily due to significant structural barriers that favor incumbents with deep capital reserves and established market presence. New players face steep upfront costs that immediately disqualify many potential competitors from entering the full-service or luxury segments where Hyatt focuses its brand strength.
High capital investment is a major barrier; while the prompt suggests an average of $22 million per property, recent data indicates that the total average cost to build a hotel ranges from $13 million to $32 million per property, setting a high initial hurdle for any new chain attempting to scale a portfolio. This capital intensity is even more pronounced in the luxury space, where construction costs can exceed $1 million per room. Specifically, the median cost to develop luxury hotels was recorded at over $1,057,000 per room as of mid-2025, making it prohibitively expensive for smaller entities to compete on physical assets in this tier.
Established brand recognition and the World of Hyatt loyalty program present a formidable, intangible barrier. The World of Hyatt program boasts more than 60 million members as of late 2025, representing a massive, engaged customer base that drives significant revenue. This program has experienced rapid growth, increasing by nearly 30% annually since 2017. Replicating this scale, member engagement, and the perceived value-with points valued around 1.8 cents per point-requires years of sustained investment and operational excellence.
Access to prime real estate locations is severely limited by incumbents like Hyatt Hotels Corporation, which, as of September 30, 2025, operated a portfolio of more than 1,450 hotels across 82 countries. Securing top-tier sites in major metropolitan areas or premier resort destinations is a competitive process often won by established players with strong relationships and proven development track records. Furthermore, the cost of land acquisition in these prime markets adds substantially to the already high construction costs.
Hyatt's asset-light franchise model, however, slightly mitigates the barrier for owners to join the Hyatt system, but not for new chains to enter the market independently. Hyatt is aggressively pursuing this model, targeting over 90% fee-based earnings by 2027, up from more than 80% being asset-light in early 2025. This strategy allows Hyatt to expand its brand footprint rapidly through management and franchise agreements without tying up its own capital, making it easier for capital-rich developers to partner with Hyatt rather than build a competing brand from scratch. The company's focus on fee-based growth is evident in its projected gross fee growth of 10% to 11% over 2024 levels for 2025.
The financial commitment required to challenge Hyatt's established ecosystem can be summarized by comparing the investment scale:
| Cost/Metric | Value | Context |
|---|---|---|
| Median Total Hotel Construction Cost (Per Room) | $219,000 | Across all surveyed properties in 2025. |
| Median Luxury Hotel Construction Cost (Per Room) | $1,057,000+ | Exceeds the $1 million threshold mentioned. |
| World of Hyatt Membership Count (Late 2025) | 60 Million+ | Indicates massive brand loyalty scale. |
| World of Hyatt Annual Growth Rate (Since 2017) | Nearly 30% | Shows high consumer adoption difficulty to match. |
| Hyatt Asset-Light Earnings Target (2027) | 90%+ | Focus on fee-based revenue over ownership. |
| Shareholder Returns (2024) | $1.25 Billion | Capital deployed by Hyatt, showing financial strength. |
The barriers to entry are thus concentrated on the following high-cost, hard-to-replicate factors:
- High initial capital outlay for new construction.
- The immense scale and value of the World of Hyatt program.
- Securing premium, high-visibility real estate sites.
- The established global portfolio of more than 1,450 managed/franchised properties.
- The proven track record of Hyatt's asset-light model execution.
For a new entrant, the required investment in brand building and loyalty program infrastructure alone represents a multi-year, multi-billion dollar commitment that few possess the risk appetite or immediate liquidity to undertake successfully.
Disclaimer
All information, articles, and product details provided on this website are for general informational and educational purposes only. We do not claim any ownership over, nor do we intend to infringe upon, any trademarks, copyrights, logos, brand names, or other intellectual property mentioned or depicted on this site. Such intellectual property remains the property of its respective owners, and any references here are made solely for identification or informational purposes, without implying any affiliation, endorsement, or partnership.
We make no representations or warranties, express or implied, regarding the accuracy, completeness, or suitability of any content or products presented. Nothing on this website should be construed as legal, tax, investment, financial, medical, or other professional advice. In addition, no part of this site—including articles or product references—constitutes a solicitation, recommendation, endorsement, advertisement, or offer to buy or sell any securities, franchises, or other financial instruments, particularly in jurisdictions where such activity would be unlawful.
All content is of a general nature and may not address the specific circumstances of any individual or entity. It is not a substitute for professional advice or services. Any actions you take based on the information provided here are strictly at your own risk. You accept full responsibility for any decisions or outcomes arising from your use of this website and agree to release us from any liability in connection with your use of, or reliance upon, the content or products found herein.