
|
Hamilton Beach Brands Holding Company (HBB) Évaluation DCF |
Entièrement Modifiable: Adapté À Vos Besoins Dans Excel Ou Sheets
Conception Professionnelle: Modèles Fiables Et Conformes Aux Normes Du Secteur
Pré-Construits Pour Une Utilisation Rapide Et Efficace
Compatible MAC/PC, entièrement débloqué
Aucune Expertise N'Est Requise; Facile À Suivre
Hamilton Beach Brands Holding Company (HBB) Bundle
Conçu pour la précision, notre calculatrice HBB DCF vous permet d'évaluer l'évaluation de la société de portefeuille de Hamilton Beach Brands à l'aide des données financières du monde réel, tout en offrant une flexibilité complète pour modifier tous les paramètres essentiels pour l'amélioration des projections.
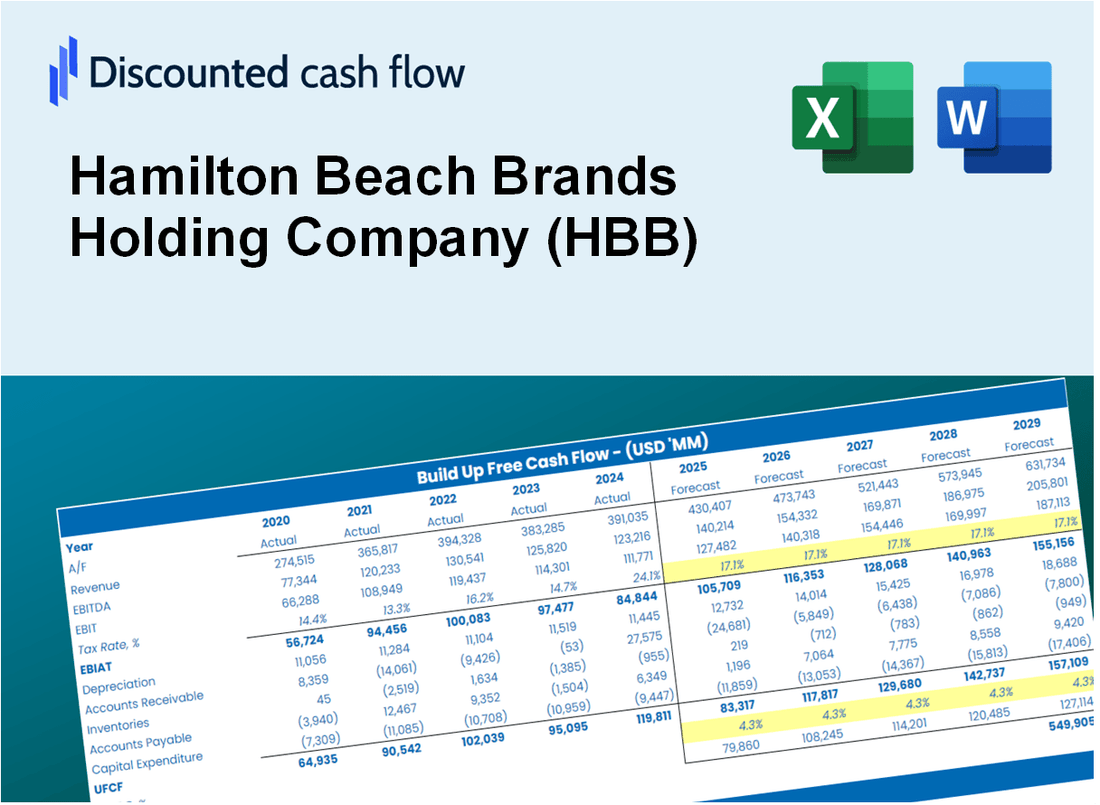
Discounted Cash Flow (DCF) - (USD MM)
| Year | AY1 2020 |
AY2 2021 |
AY3 2022 |
AY4 2023 |
AY5 2024 |
FY1 2025 |
FY2 2026 |
FY3 2027 |
FY4 2028 |
FY5 2029 |
|---|---|---|---|---|---|---|---|---|---|---|
| Revenue | 603.7 | 658.4 | 640.9 | 625.6 | 654.7 | 668.9 | 683.4 | 698.2 | 713.3 | 728.7 |
| Revenue Growth, % | 0 | 9.06 | -2.65 | -2.39 | 4.65 | 2.17 | 2.17 | 2.17 | 2.17 | 2.17 |
| EBITDA | 39.6 | 36.7 | 41.9 | 39.1 | 38.8 | 41.3 | 42.2 | 43.1 | 44.0 | 45.0 |
| EBITDA, % | 6.57 | 5.58 | 6.54 | 6.24 | 5.92 | 6.17 | 6.17 | 6.17 | 6.17 | 6.17 |
| Depreciation | 3.9 | 4.9 | 4.9 | 4.4 | 4.8 | 4.8 | 4.9 | 5.0 | 5.1 | 5.2 |
| Depreciation, % | 0.64716 | 0.74621 | 0.76184 | 0.69722 | 0.73332 | 0.71715 | 0.71715 | 0.71715 | 0.71715 | 0.71715 |
| EBIT | 35.7 | 31.8 | 37.0 | 34.7 | 34.0 | 36.5 | 37.3 | 38.1 | 38.9 | 39.7 |
| EBIT, % | 5.92 | 4.83 | 5.78 | 5.55 | 5.19 | 5.45 | 5.45 | 5.45 | 5.45 | 5.45 |
| Total Cash | 2.4 | 1.1 | .9 | 15.4 | 45.6 | 13.6 | 13.9 | 14.2 | 14.5 | 14.8 |
| Total Cash, percent | .0 | .0 | .0 | .0 | .0 | .0 | .0 | .0 | .0 | .0 |
| Account Receivables | 144.8 | 119.6 | 115.1 | 135.4 | 117.1 | 133.3 | 136.2 | 139.1 | 142.1 | 145.2 |
| Account Receivables, % | 23.98 | 18.16 | 17.96 | 21.65 | 17.88 | 19.93 | 19.93 | 19.93 | 19.93 | 19.93 |
| Inventories | 174.0 | 183.4 | 156.0 | 126.6 | 124.9 | 161.0 | 164.4 | 168.0 | 171.6 | 175.4 |
| Inventories, % | 28.82 | 27.85 | 24.34 | 20.23 | 19.08 | 24.06 | 24.06 | 24.06 | 24.06 | 24.06 |
| Accounts Payable | 152.6 | 131.9 | 61.8 | 99.7 | 104.2 | 116.1 | 118.6 | 121.2 | 123.8 | 126.5 |
| Accounts Payable, % | 25.27 | 20.04 | 9.64 | 15.94 | 15.91 | 17.36 | 17.36 | 17.36 | 17.36 | 17.36 |
| Capital Expenditure | -3.3 | -11.8 | -2.3 | -3.4 | -3.2 | -5.0 | -5.1 | -5.2 | -5.3 | -5.4 |
| Capital Expenditure, % | -0.54861 | -1.8 | -0.35557 | -0.54649 | -0.48771 | -0.74746 | -0.74746 | -0.74746 | -0.74746 | -0.74746 |
| Tax Rate, % | 7.84 | 7.84 | 7.84 | 7.84 | 7.84 | 7.84 | 7.84 | 7.84 | 7.84 | 7.84 |
| EBITAT | 25.5 | 23.4 | 28.8 | 27.6 | 31.3 | 28.8 | 29.4 | 30.0 | 30.7 | 31.4 |
| Depreciation | ||||||||||
| Changes in Account Receivables | ||||||||||
| Changes in Inventories | ||||||||||
| Changes in Accounts Payable | ||||||||||
| Capital Expenditure | ||||||||||
| UFCF | -140.1 | 11.6 | -6.9 | 75.7 | 57.4 | -11.8 | 25.3 | 25.9 | 26.5 | 27.0 |
| WACC, % | 3.93 | 3.96 | 4.01 | 4.02 | 4.16 | 4.02 | 4.02 | 4.02 | 4.02 | 4.02 |
| PV UFCF | ||||||||||
| SUM PV UFCF | 79.9 | |||||||||
| Long Term Growth Rate, % | 0.50 | |||||||||
| Free cash flow (T + 1) | 27 | |||||||||
| Terminal Value | 772 | |||||||||
| Present Terminal Value | 634 | |||||||||
| Enterprise Value | 714 | |||||||||
| Net Debt | 49 | |||||||||
| Equity Value | 666 | |||||||||
| Diluted Shares Outstanding, MM | 14 | |||||||||
| Equity Value Per Share | 47.67 |
What You Will Get
- Real HBB Financial Data: Pre-filled with Hamilton Beach Brands Holding Company’s historical and projected data for precise analysis.
- Fully Editable Template: Modify key inputs like revenue growth, WACC, and EBITDA % with ease.
- Automatic Calculations: See HBB’s intrinsic value update instantly based on your changes.
- Professional Valuation Tool: Designed for investors, analysts, and consultants seeking accurate DCF results.
- User-Friendly Design: Simple structure and clear instructions for all experience levels.
Key Features
- Comprehensive HBB Data: Pre-loaded with Hamilton Beach's historical performance and future growth projections.
- Customizable Financial Assumptions: Modify revenue growth rates, profit margins, WACC, tax rates, and capital expenditures as needed.
- Interactive Valuation Model: Automatically recalculates Net Present Value (NPV) and intrinsic value based on user-defined inputs.
- Scenario Analysis: Develop various forecasting scenarios to explore different valuation results.
- Intuitive User Interface: Designed for ease of use, catering to both professionals and newcomers.
How It Works
- Step 1: Download the prebuilt Excel template featuring Hamilton Beach Brands Holding Company's (HBB) data.
- Step 2: Navigate through the pre-filled sheets to familiarize yourself with the essential metrics.
- Step 3: Modify forecasts and assumptions in the editable yellow cells (WACC, growth, margins).
- Step 4: Instantly see the updated results, including Hamilton Beach Brands Holding Company's (HBB) intrinsic value.
- Step 5: Utilize the outputs to make well-informed investment decisions or create comprehensive reports.
Why Choose Hamilton Beach Brands (HBB)?
- Time Efficiency: Skip the hassle of building a financial model from the ground up – our tools are ready for immediate use.
- Enhanced Accuracy: Dependable financial metrics and calculations minimize valuation errors.
- Completely Customizable: Adjust the model to align with your specific assumptions and forecasts.
- User-Friendly: Intuitive graphs and outputs simplify the analysis of results.
- Endorsed by Professionals: Crafted for experts who prioritize accuracy and functionality.
Who Should Use This Product?
- Investors: Evaluate Hamilton Beach Brands Holding Company's (HBB) market performance before making investment decisions.
- CFOs and Financial Analysts: Optimize valuation methods and validate financial forecasts for HBB.
- Startup Founders: Understand the valuation strategies of established companies like Hamilton Beach.
- Consultants: Create detailed valuation reports tailored for clients interested in HBB.
- Students and Educators: Utilize HBB’s data to teach and practice valuation principles in a real-world context.
What the Template Contains
- Pre-Filled Data: Includes Hamilton Beach Brands Holding Company's (HBB) historical financials and forecasts.
- Discounted Cash Flow Model: Editable DCF valuation model with automatic calculations tailored for (HBB).
- Weighted Average Cost of Capital (WACC): A dedicated sheet for calculating WACC based on custom inputs specific to (HBB).
- Key Financial Ratios: Analyze (HBB)’s profitability, efficiency, and leverage metrics.
- Customizable Inputs: Easily edit revenue growth, margins, and tax rates for (HBB).
- Clear Dashboard: Visuals and tables summarizing key valuation results for (HBB).
Disclaimer
All information, articles, and product details provided on this website are for general informational and educational purposes only. We do not claim any ownership over, nor do we intend to infringe upon, any trademarks, copyrights, logos, brand names, or other intellectual property mentioned or depicted on this site. Such intellectual property remains the property of its respective owners, and any references here are made solely for identification or informational purposes, without implying any affiliation, endorsement, or partnership.
We make no representations or warranties, express or implied, regarding the accuracy, completeness, or suitability of any content or products presented. Nothing on this website should be construed as legal, tax, investment, financial, medical, or other professional advice. In addition, no part of this site—including articles or product references—constitutes a solicitation, recommendation, endorsement, advertisement, or offer to buy or sell any securities, franchises, or other financial instruments, particularly in jurisdictions where such activity would be unlawful.
All content is of a general nature and may not address the specific circumstances of any individual or entity. It is not a substitute for professional advice or services. Any actions you take based on the information provided here are strictly at your own risk. You accept full responsibility for any decisions or outcomes arising from your use of this website and agree to release us from any liability in connection with your use of, or reliance upon, the content or products found herein.