
|
Horizon Bancorp, Inc. (HBNC) Évaluation DCF |
Entièrement Modifiable: Adapté À Vos Besoins Dans Excel Ou Sheets
Conception Professionnelle: Modèles Fiables Et Conformes Aux Normes Du Secteur
Pré-Construits Pour Une Utilisation Rapide Et Efficace
Compatible MAC/PC, entièrement débloqué
Aucune Expertise N'Est Requise; Facile À Suivre
Horizon Bancorp, Inc. (HBNC) Bundle
Que vous soyez un investisseur ou un analyste, cette calculatrice DCF (HBNC) est votre ressource incontournable pour des évaluations précises. Chargé de données réelles d'Horizon Bancorp, Inc., vous pouvez ajuster les prévisions et observer immédiatement les effets.
What You Will Receive
- Pre-Loaded Financial Model: Horizon Bancorp's actual data facilitates accurate DCF valuation.
- Comprehensive Forecast Control: Modify revenue growth, profit margins, WACC, and other critical factors.
- Real-Time Calculations: Instant updates ensure you view results as you implement changes.
- Investor-Ready Template: A polished Excel file crafted for high-quality valuation.
- Customizable and Reusable: Designed for adaptability, enabling repeated use for in-depth forecasts.
Key Features
- Accurate Financial Data for Horizon Bancorp: Gain access to reliable historical data and future forecasts tailored for HBNC.
- Adjustable Financial Assumptions: Modify highlighted fields such as WACC, growth rates, and profit margins to suit your analysis.
- Real-Time Calculations: Enjoy automatic updates for DCF, Net Present Value (NPV), and cash flow assessments.
- User-Friendly Visual Dashboard: Effortlessly interpret valuation results with clear charts and summaries.
- Designed for All Skill Levels: A straightforward, intuitive layout catering to investors, CFOs, and consultants alike.
How It Works
- Step 1: Download the Excel file.
- Step 2: Review pre-entered Horizon Bancorp, Inc. (HBNC) data (historical and projected).
- Step 3: Adjust key assumptions (yellow cells) based on your analysis.
- Step 4: View automatic recalculations for Horizon Bancorp, Inc. (HBNC)’s intrinsic value.
- Step 5: Use the outputs for investment decisions or reporting.
Why Choose This Calculator for Horizon Bancorp, Inc. (HBNC)?
- Designed for Financial Experts: A sophisticated tool utilized by financial analysts, investors, and bankers.
- Comprehensive Data: Horizon Bancorp’s historical and projected financials are preloaded for precision.
- Flexible Scenario Analysis: Effortlessly simulate various forecasts and assumptions.
- Insightful Outputs: Automatically computes intrinsic value, NPV, and essential financial metrics.
- User-Friendly: Step-by-step guidance ensures a smooth and straightforward experience.
Who Should Use This Product?
- Investors: Evaluate Horizon Bancorp's (HBNC) performance before making investment decisions.
- CFOs and Financial Analysts: Enhance financial analysis and optimize valuation methodologies.
- Startup Founders: Understand the valuation strategies of established financial institutions like Horizon Bancorp.
- Consultants: Provide comprehensive valuation assessments for clients in the banking sector.
- Students and Educators: Utilize current financial data to teach and learn valuation practices.
What the Template Contains
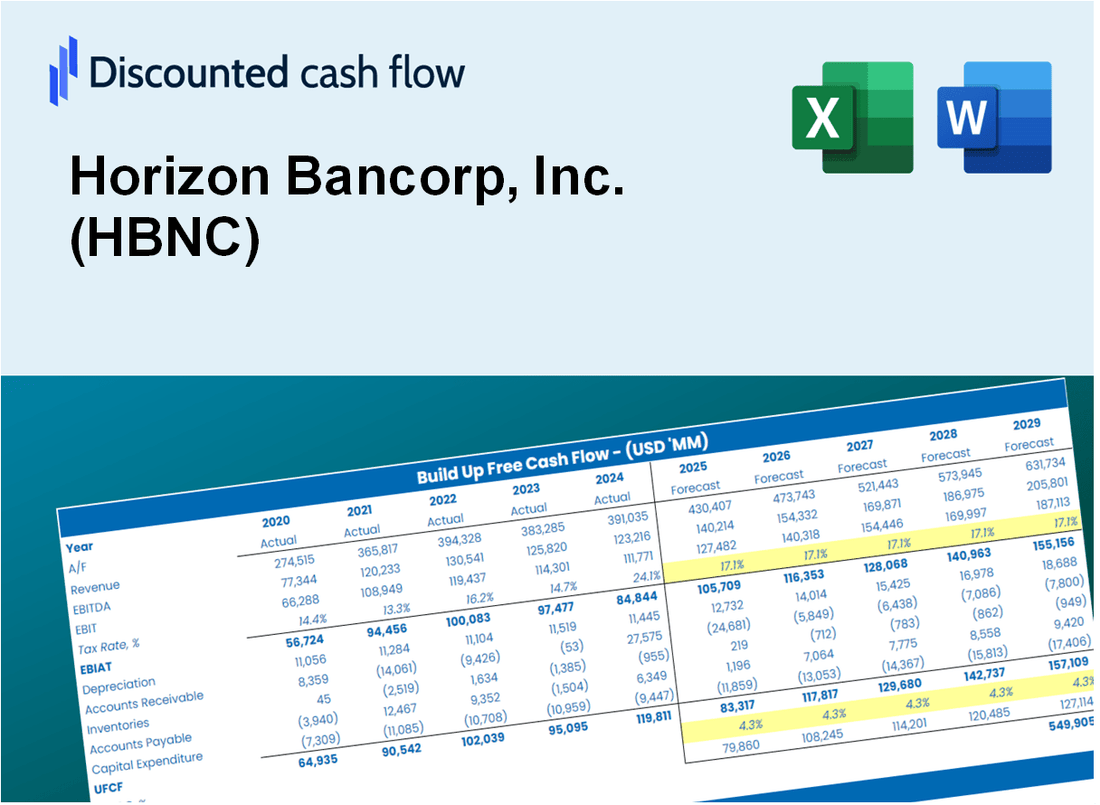
- Operating and Balance Sheet Data: Pre-filled Horizon Bancorp, Inc. (HBNC) historical data and forecasts, including revenue, EBITDA, EBIT, and capital expenditures.
- WACC Calculation: A dedicated sheet for Weighted Average Cost of Capital (WACC), featuring parameters such as Beta, risk-free rate, and share price.
- DCF Valuation (Unlevered and Levered): Editable Discounted Cash Flow models illustrating intrinsic value with comprehensive calculations.
- Financial Statements: Pre-loaded financial statements (annual and quarterly) to aid in analysis.
- Key Ratios: Includes profitability, leverage, and efficiency ratios for Horizon Bancorp, Inc. (HBNC).
- Dashboard and Charts: Visual summary of valuation outputs and assumptions for easy result analysis.
Disclaimer
All information, articles, and product details provided on this website are for general informational and educational purposes only. We do not claim any ownership over, nor do we intend to infringe upon, any trademarks, copyrights, logos, brand names, or other intellectual property mentioned or depicted on this site. Such intellectual property remains the property of its respective owners, and any references here are made solely for identification or informational purposes, without implying any affiliation, endorsement, or partnership.
We make no representations or warranties, express or implied, regarding the accuracy, completeness, or suitability of any content or products presented. Nothing on this website should be construed as legal, tax, investment, financial, medical, or other professional advice. In addition, no part of this site—including articles or product references—constitutes a solicitation, recommendation, endorsement, advertisement, or offer to buy or sell any securities, franchises, or other financial instruments, particularly in jurisdictions where such activity would be unlawful.
All content is of a general nature and may not address the specific circumstances of any individual or entity. It is not a substitute for professional advice or services. Any actions you take based on the information provided here are strictly at your own risk. You accept full responsibility for any decisions or outcomes arising from your use of this website and agree to release us from any liability in connection with your use of, or reliance upon, the content or products found herein.