
|
HBT Financial, Inc. (HBT) Évaluation DCF |
Entièrement Modifiable: Adapté À Vos Besoins Dans Excel Ou Sheets
Conception Professionnelle: Modèles Fiables Et Conformes Aux Normes Du Secteur
Pré-Construits Pour Une Utilisation Rapide Et Efficace
Compatible MAC/PC, entièrement débloqué
Aucune Expertise N'Est Requise; Facile À Suivre
HBT Financial, Inc. (HBT) Bundle
Vous cherchez à évaluer la valeur intrinsèque de HBT Financial, Inc.? Notre calculatrice HBT DCF intègre des données réelles avec des fonctionnalités de personnalisation étendues, vous permettant d'affiner vos projections et d'améliorer vos choix d'investissement.
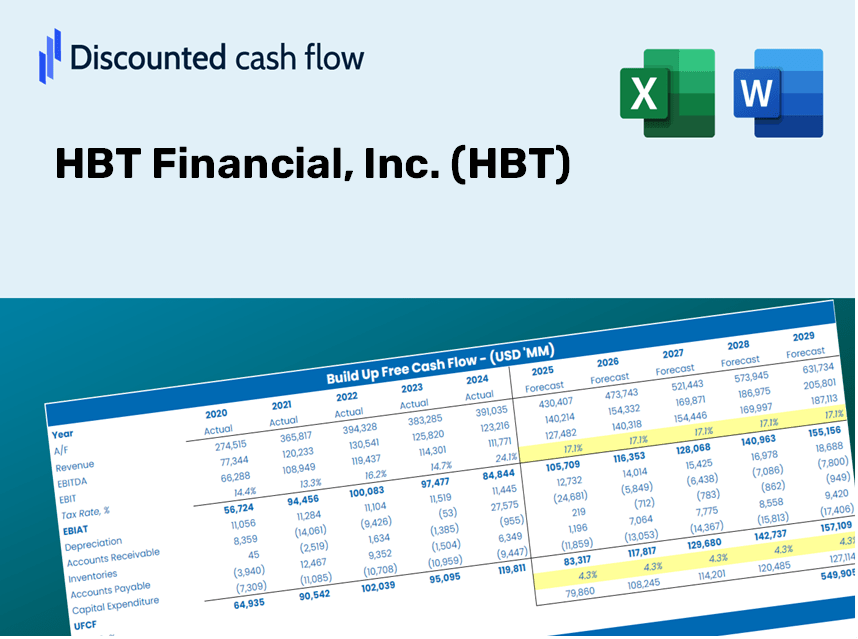
Discounted Cash Flow (DCF) - (USD MM)
| Year | AY1 2020 |
AY2 2021 |
AY3 2022 |
AY4 2023 |
AY5 2024 |
FY1 2025 |
FY2 2026 |
FY3 2027 |
FY4 2028 |
FY5 2029 |
|---|---|---|---|---|---|---|---|---|---|---|
| Revenue | 156.8 | 164.2 | 186.7 | 263.6 | 285.2 | 333.6 | 390.2 | 456.3 | 533.7 | 624.2 |
| Revenue Growth, % | 0 | 4.76 | 13.69 | 41.2 | 8.18 | 16.96 | 16.96 | 16.96 | 16.96 | 16.96 |
| EBITDA | 53.7 | 80.7 | 80.1 | 94.4 | 103.2 | 132.3 | 154.7 | 181.0 | 211.6 | 247.5 |
| EBITDA, % | 34.28 | 49.13 | 42.9 | 35.79 | 36.17 | 39.66 | 39.66 | 39.66 | 39.66 | 39.66 |
| Depreciation | 4.2 | 4.1 | 3.9 | 5.8 | 5.8 | 7.7 | 9.0 | 10.5 | 12.3 | 14.3 |
| Depreciation, % | 2.66 | 2.51 | 2.1 | 2.19 | 2.03 | 2.3 | 2.3 | 2.3 | 2.3 | 2.3 |
| EBIT | 49.6 | 76.6 | 76.2 | 88.6 | 97.4 | 124.6 | 145.8 | 170.5 | 199.4 | 233.2 |
| EBIT, % | 31.62 | 46.62 | 40.8 | 33.6 | 34.14 | 37.36 | 37.36 | 37.36 | 37.36 | 37.36 |
| Total Cash | 1,235.3 | 1,351.9 | 957.7 | 901.2 | 190.0 | 311.3 | 364.1 | 425.8 | 498.1 | 582.5 |
| Total Cash, percent | .0 | .0 | .0 | .0 | .0 | .0 | .0 | .0 | .0 | .0 |
| Account Receivables | 14.3 | 14.9 | 19.5 | 24.5 | 24.8 | 31.1 | 36.4 | 42.5 | 49.7 | 58.2 |
| Account Receivables, % | 9.09 | 9.07 | 10.45 | 9.31 | 8.68 | 9.32 | 9.32 | 9.32 | 9.32 | 9.32 |
| Inventories | .0 | .0 | .0 | .0 | .0 | .0 | .0 | .0 | .0 | .0 |
| Inventories, % | 0 | 0 | 0 | 0 | 0 | 0 | 0 | 0 | 0 | 0 |
| Accounts Payable | .0 | .0 | .0 | .0 | .0 | .0 | .0 | .0 | .0 | .0 |
| Accounts Payable, % | 0 | 0 | 0 | 0 | 0 | 0 | 0 | 0 | 0 | 0 |
| Capital Expenditure | -1.9 | -1.0 | -1.0 | -3.1 | -5.5 | -3.7 | -4.3 | -5.0 | -5.9 | -6.9 |
| Capital Expenditure, % | -1.19 | -0.62594 | -0.56073 | -1.19 | -1.93 | -1.1 | -1.1 | -1.1 | -1.1 | -1.1 |
| Tax Rate, % | 26.29 | 26.29 | 26.29 | 26.29 | 26.29 | 26.29 | 26.29 | 26.29 | 26.29 | 26.29 |
| EBITAT | 36.8 | 56.3 | 56.5 | 65.8 | 71.8 | 92.2 | 107.8 | 126.1 | 147.5 | 172.5 |
| Depreciation | ||||||||||
| Changes in Account Receivables | ||||||||||
| Changes in Inventories | ||||||||||
| Changes in Accounts Payable | ||||||||||
| Capital Expenditure | ||||||||||
| UFCF | 24.9 | 58.7 | 54.7 | 63.5 | 71.8 | 89.9 | 107.2 | 125.4 | 146.7 | 171.6 |
| WACC, % | 10.76 | 10.7 | 10.75 | 10.76 | 10.72 | 10.74 | 10.74 | 10.74 | 10.74 | 10.74 |
| PV UFCF | ||||||||||
| SUM PV UFCF | 461.6 | |||||||||
| Long Term Growth Rate, % | 2.00 | |||||||||
| Free cash flow (T + 1) | 175 | |||||||||
| Terminal Value | 2,003 | |||||||||
| Present Terminal Value | 1,203 | |||||||||
| Enterprise Value | 1,664 | |||||||||
| Net Debt | -3 | |||||||||
| Equity Value | 1,668 | |||||||||
| Diluted Shares Outstanding, MM | 32 | |||||||||
| Equity Value Per Share | 52.58 |
What You Will Get
- Real HBT Data: Preloaded financials – from revenue to EBIT – based on actual and projected figures for HBT Financial, Inc. (HBT).
- Full Customization: Adjust all key parameters (yellow cells) like WACC, growth %, and tax rates to fit your analysis.
- Instant Valuation Updates: Automatic recalculations to assess the influence of changes on HBT’s fair value.
- Versatile Excel Template: Designed for quick modifications, scenario testing, and comprehensive projections.
- Time-Saving and Accurate: Avoid starting from scratch while ensuring accuracy and adaptability in your modeling.
Key Features
- Customizable Forecast Inputs: Easily adjust essential parameters such as revenue growth, EBITDA margin, and capital expenditures.
- Instant DCF Valuation: Automatically computes intrinsic value, NPV, and other financial metrics in real-time.
- Industry-Leading Precision: Leverages HBT Financial's actual financial data for accurate valuation results.
- Simplified Scenario Analysis: Effortlessly explore various assumptions and analyze different outcomes.
- Efficiency Booster: Streamlines the valuation process, removing the need to create complex models from the ground up.
How It Works
- Step 1: Download the Excel file.
- Step 2: Review the pre-filled HBT data (historical and projected).
- Step 3: Modify key assumptions (yellow cells) based on your insights.
- Step 4: Observe the automatic updates for HBT's intrinsic value.
- Step 5: Utilize the results for your investment strategies or reporting needs.
Why Opt for HBT Financial's Calculator?
- Save Time: Jump straight into calculations with our pre-built model—no setup required.
- Enhance Accuracy: Our dependable financial data and formulas minimize valuation errors.
- Completely Customizable: Adjust the model to align with your specific assumptions and forecasts.
- User-Friendly: Intuitive charts and outputs simplify result analysis.
- Expert Endorsement: Crafted for professionals who prioritize precision and ease of use.
Who Can Benefit from HBT Financial, Inc. (HBT)?
- Individual Investors: Gain insights to make informed choices about purchasing or selling HBT stock.
- Financial Analysts: Enhance valuation processes with easily accessible financial models specific to HBT.
- Consultants: Provide clients with accurate and swift valuation insights related to HBT.
- Business Owners: Learn how established companies like HBT are valued to inform your strategic decisions.
- Finance Students: Acquire practical valuation skills using real data and case studies centered around HBT.
Contents of the Template
- Preloaded HBT Data: Historical and forecasted financial metrics, including revenue, EBIT, and capital expenditures.
- DCF and WACC Models: Advanced sheets designed for calculating intrinsic value and Weighted Average Cost of Capital.
- Editable Inputs: Cells highlighted in yellow for modifying revenue growth, tax rates, and discount rates.
- Financial Statements: Detailed annual and quarterly financial reports for thorough analysis.
- Key Ratios: Metrics on profitability, leverage, and efficiency to assess operational performance.
- Dashboard and Charts: Visual representations of valuation results and underlying assumptions.
Disclaimer
All information, articles, and product details provided on this website are for general informational and educational purposes only. We do not claim any ownership over, nor do we intend to infringe upon, any trademarks, copyrights, logos, brand names, or other intellectual property mentioned or depicted on this site. Such intellectual property remains the property of its respective owners, and any references here are made solely for identification or informational purposes, without implying any affiliation, endorsement, or partnership.
We make no representations or warranties, express or implied, regarding the accuracy, completeness, or suitability of any content or products presented. Nothing on this website should be construed as legal, tax, investment, financial, medical, or other professional advice. In addition, no part of this site—including articles or product references—constitutes a solicitation, recommendation, endorsement, advertisement, or offer to buy or sell any securities, franchises, or other financial instruments, particularly in jurisdictions where such activity would be unlawful.
All content is of a general nature and may not address the specific circumstances of any individual or entity. It is not a substitute for professional advice or services. Any actions you take based on the information provided here are strictly at your own risk. You accept full responsibility for any decisions or outcomes arising from your use of this website and agree to release us from any liability in connection with your use of, or reliance upon, the content or products found herein.