
|
HEG Limited (Heg.NS) Valation DCF |
Entièrement Modifiable: Adapté À Vos Besoins Dans Excel Ou Sheets
Conception Professionnelle: Modèles Fiables Et Conformes Aux Normes Du Secteur
Pré-Construits Pour Une Utilisation Rapide Et Efficace
Compatible MAC/PC, entièrement débloqué
Aucune Expertise N'Est Requise; Facile À Suivre
HEG Limited (HEG.NS) Bundle
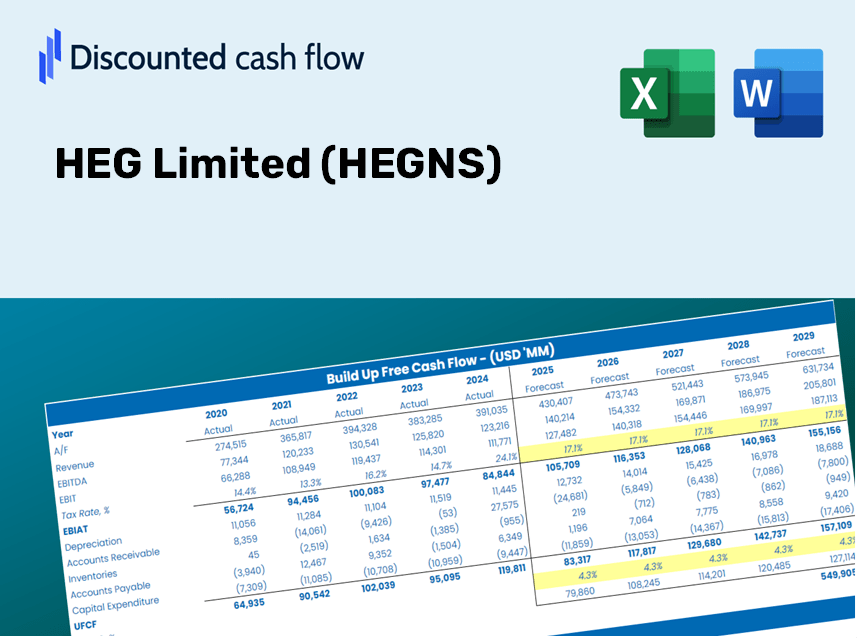
Évaluez les perspectives financières de Heg Limited comme un expert! Cette calculatrice (HeGNS) DCF est livrée avec des données financières pré-remplies et offre une flexibilité totale pour ajuster la croissance des revenus, le WACC, les marges et d'autres hypothèses essentielles pour s'aligner sur vos projections.
Discounted Cash Flow (DCF) - (USD MM)
| Year | AY1 2021 |
AY2 2022 |
AY3 2023 |
AY4 2024 |
AY5 2025 |
FY1 2026 |
FY2 2027 |
FY3 2028 |
FY4 2029 |
FY5 2030 |
|---|---|---|---|---|---|---|---|---|---|---|
| Revenue | 12,344.3 | 21,732.3 | 24,353.2 | 23,798.2 | 21,443.2 | 25,514.0 | 30,357.6 | 36,120.7 | 42,977.8 | 51,136.7 |
| Revenue Growth, % | 0 | 76.05 | 12.06 | -2.28 | -9.9 | 18.98 | 18.98 | 18.98 | 18.98 | 18.98 |
| EBITDA | 532.4 | 6,467.7 | 8,054.2 | 5,237.6 | 3,780.3 | 5,449.0 | 6,483.4 | 7,714.2 | 9,178.7 | 10,921.2 |
| EBITDA, % | 4.31 | 29.76 | 33.07 | 22.01 | 17.63 | 21.36 | 21.36 | 21.36 | 21.36 | 21.36 |
| Depreciation | 731.2 | 792.9 | 1,023.0 | 1,743.1 | 2,005.9 | 1,553.9 | 1,848.8 | 2,199.8 | 2,617.5 | 3,114.4 |
| Depreciation, % | 5.92 | 3.65 | 4.2 | 7.32 | 9.35 | 6.09 | 6.09 | 6.09 | 6.09 | 6.09 |
| EBIT | -198.7 | 5,674.8 | 7,031.2 | 3,494.5 | 1,774.4 | 3,895.1 | 4,634.6 | 5,514.4 | 6,561.3 | 7,806.9 |
| EBIT, % | -1.61 | 26.11 | 28.87 | 14.68 | 8.27 | 15.27 | 15.27 | 15.27 | 15.27 | 15.27 |
| Total Cash | 10,524.5 | 12,463.2 | 7,672.9 | 7,119.7 | 6,089.6 | 11,860.4 | 14,111.9 | 16,791.0 | 19,978.6 | 23,771.3 |
| Total Cash, percent | .0 | .0 | .0 | .0 | .0 | .0 | .0 | .0 | .0 | .0 |
| Account Receivables | 2,894.2 | 5,891.7 | 4,891.4 | 5,618.5 | 4,455.3 | 5,869.6 | 6,983.9 | 8,309.7 | 9,887.3 | 11,764.3 |
| Account Receivables, % | 23.45 | 27.11 | 20.09 | 23.61 | 20.78 | 23.01 | 23.01 | 23.01 | 23.01 | 23.01 |
| Inventories | 5,806.1 | 9,778.1 | 14,401.2 | 11,941.5 | 12,546.4 | 13,259.7 | 15,776.9 | 18,772.0 | 22,335.7 | 26,575.9 |
| Inventories, % | 47.03 | 44.99 | 59.13 | 50.18 | 58.51 | 51.97 | 51.97 | 51.97 | 51.97 | 51.97 |
| Accounts Payable | 2,573.1 | 4,478.9 | 2,582.4 | 4,253.0 | 3,992.9 | 4,518.5 | 5,376.3 | 6,396.9 | 7,611.3 | 9,056.3 |
| Accounts Payable, % | 20.84 | 20.61 | 10.6 | 17.87 | 18.62 | 17.71 | 17.71 | 17.71 | 17.71 | 17.71 |
| Capital Expenditure | -2,560.6 | -3,595.3 | -4,797.4 | -3,715.2 | -1,822.3 | -4,138.1 | -4,923.7 | -5,858.4 | -6,970.6 | -8,293.9 |
| Capital Expenditure, % | -20.74 | -16.54 | -19.7 | -15.61 | -8.5 | -16.22 | -16.22 | -16.22 | -16.22 | -16.22 |
| Tax Rate, % | 28.25 | 28.25 | 28.25 | 28.25 | 28.25 | 28.25 | 28.25 | 28.25 | 28.25 | 28.25 |
| EBITAT | -152.4 | 4,364.5 | 5,526.4 | 2,754.8 | 1,273.1 | 2,981.8 | 3,547.8 | 4,221.3 | 5,022.7 | 5,976.2 |
| Depreciation | ||||||||||
| Changes in Account Receivables | ||||||||||
| Changes in Inventories | ||||||||||
| Changes in Accounts Payable | ||||||||||
| Capital Expenditure | ||||||||||
| UFCF | -8,109.0 | -3,501.7 | -3,767.2 | 4,185.9 | 1,754.9 | -1,204.5 | -2,300.7 | -2,737.5 | -3,257.2 | -3,875.6 |
| WACC, % | 8.46 | 8.46 | 8.47 | 8.47 | 8.44 | 8.46 | 8.46 | 8.46 | 8.46 | 8.46 |
| PV UFCF | ||||||||||
| SUM PV UFCF | -10,147.7 | |||||||||
| Long Term Growth Rate, % | 4.00 | |||||||||
| Free cash flow (T + 1) | -4,031 | |||||||||
| Terminal Value | -90,356 | |||||||||
| Present Terminal Value | -60,200 | |||||||||
| Enterprise Value | -70,347 | |||||||||
| Net Debt | 5,369 | |||||||||
| Equity Value | -75,717 | |||||||||
| Diluted Shares Outstanding, MM | 193 | |||||||||
| Equity Value Per Share | -392.20 |
What You Will Receive
- Genuine HEG Data: Comprehensive financials – from revenue to EBIT – derived from actual and projected statistics.
- Complete Customization: Modify all vital parameters (highlighted cells) such as WACC, growth %, and tax rates.
- Real-Time Valuation Adjustments: Automatic recalculations to assess the effects of changes on HEG Limited’s fair value.
- Flexible Excel Template: Designed for quick modifications, scenario analysis, and in-depth projections.
- Efficient and Precise: Bypass the hassle of building models from the ground up while ensuring accuracy and adaptability.
Essential Features
- Comprehensive Data: HEG Limited’s (HEGNS) historical financial records and pre-populated forecasts.
- Customizable Parameters: Modify WACC, tax rates, revenue growth, and EBITDA margins as needed.
- Real-Time Calculations: Watch HEG Limited’s intrinsic value update instantly.
- Visual Insights: Intuitive dashboard charts present valuation findings and essential metrics.
- Engineered for Precision: An expert-grade tool tailored for analysts, investors, and financial professionals.
How It Functions
- Step 1: Download the Excel spreadsheet.
- Step 2: Examine the pre-filled data for HEG Limited (HEGNS), including historical and forecasted figures.
- Step 3: Modify key assumptions (highlighted in yellow) based on your findings.
- Step 4: Observe automatic updates reflecting HEG Limited's (HEGNS) intrinsic value.
- Step 5: Utilize the results for your investment strategies or reporting needs.
Why Choose This Calculator?
- Designed for Experts: A sophisticated tool favored by analysts, CFOs, and consultants.
- Accurate Financial Data: HEG Limited's historical and projected financials preloaded for precision.
- Versatile Scenario Analysis: Effortlessly model various forecasts and assumptions.
- Comprehensive Outputs: Automatically computes intrinsic value, NPV, and essential metrics.
- User-Friendly: Step-by-step guidance makes the process straightforward.
Who Should Consider HEG Limited (HEGNS)?
- Institutional Investors: Develop comprehensive and dependable valuation models for portfolio assessment.
- Corporate Finance Departments: Evaluate valuation scenarios to inform strategic decision-making.
- Financial Advisors and Consultants: Equip clients with precise valuation insights pertaining to HEG Limited (HEGNS).
- Academic Students and Instructors: Leverage real-life data for practical applications in financial modeling and education.
- Tech Industry Enthusiasts: Gain insights into the valuation processes of tech companies like HEG Limited (HEGNS) in the marketplace.
Contents of the Template
- Detailed DCF Model: Customizable template featuring comprehensive valuation calculations.
- Historical and Projected Data: HEG Limited’s (HEGNS) financial metrics preloaded for thorough analysis.
- Flexible Parameters: Modify WACC, growth rates, and tax assumptions to explore various scenarios.
- Financial Statements: Complete annual and quarterly reports for in-depth understanding.
- Key Financial Ratios: Integrated analysis for assessing profitability, efficiency, and financial leverage.
- Dashboard with Visual Analytics: Graphs and tables that present clear, actionable insights.
Disclaimer
All information, articles, and product details provided on this website are for general informational and educational purposes only. We do not claim any ownership over, nor do we intend to infringe upon, any trademarks, copyrights, logos, brand names, or other intellectual property mentioned or depicted on this site. Such intellectual property remains the property of its respective owners, and any references here are made solely for identification or informational purposes, without implying any affiliation, endorsement, or partnership.
We make no representations or warranties, express or implied, regarding the accuracy, completeness, or suitability of any content or products presented. Nothing on this website should be construed as legal, tax, investment, financial, medical, or other professional advice. In addition, no part of this site—including articles or product references—constitutes a solicitation, recommendation, endorsement, advertisement, or offer to buy or sell any securities, franchises, or other financial instruments, particularly in jurisdictions where such activity would be unlawful.
All content is of a general nature and may not address the specific circumstances of any individual or entity. It is not a substitute for professional advice or services. Any actions you take based on the information provided here are strictly at your own risk. You accept full responsibility for any decisions or outcomes arising from your use of this website and agree to release us from any liability in connection with your use of, or reliance upon, the content or products found herein.