
|
Highwoods Properties, Inc. (HIW) Évaluation DCF |
Entièrement Modifiable: Adapté À Vos Besoins Dans Excel Ou Sheets
Conception Professionnelle: Modèles Fiables Et Conformes Aux Normes Du Secteur
Pré-Construits Pour Une Utilisation Rapide Et Efficace
Compatible MAC/PC, entièrement débloqué
Aucune Expertise N'Est Requise; Facile À Suivre
Highwoods Properties, Inc. (HIW) Bundle
Vous cherchez à déterminer la valeur intrinsèque de Highwoods Properties, Inc.? Notre calculatrice HIW DCF intègre des données réelles avec des options de personnalisation étendues, vous permettant d'ajuster les prévisions et d'améliorer vos stratégies d'investissement.
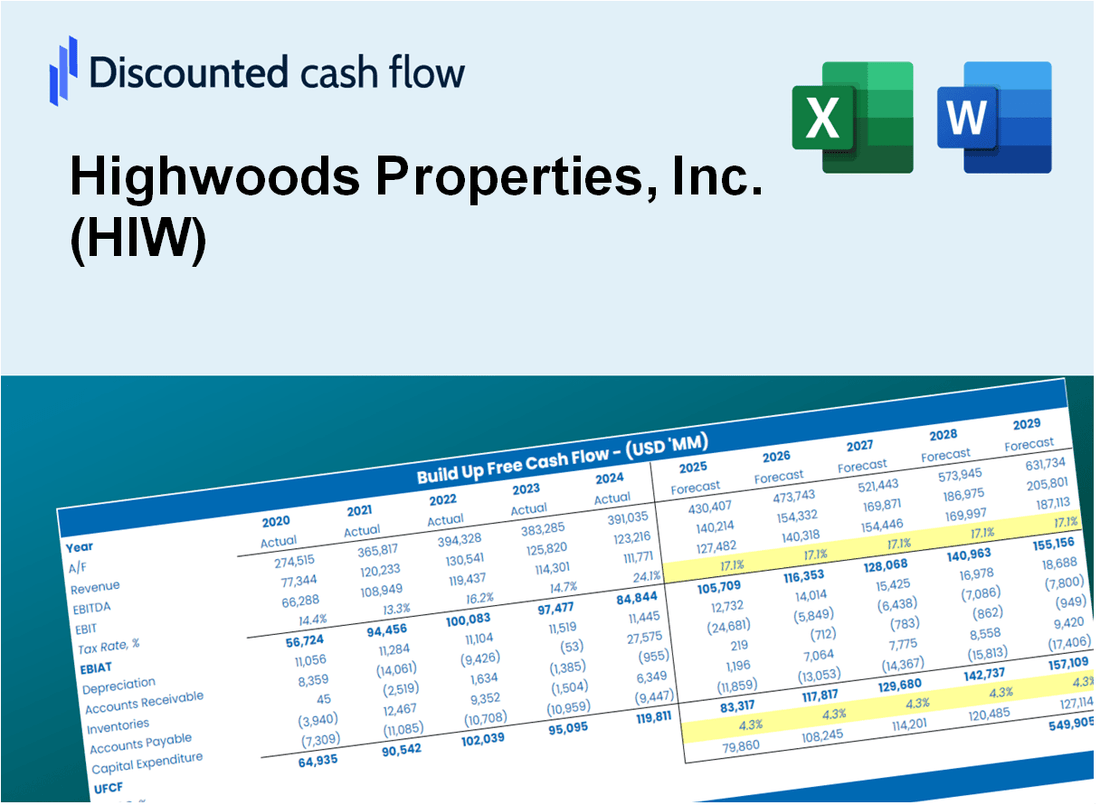
Discounted Cash Flow (DCF) - (USD MM)
| Year | AY1 2020 |
AY2 2021 |
AY3 2022 |
AY4 2023 |
AY5 2024 |
FY1 2025 |
FY2 2026 |
FY3 2027 |
FY4 2028 |
FY5 2029 |
|---|---|---|---|---|---|---|---|---|---|---|
| Revenue | 736.9 | 768.0 | 828.9 | 834.0 | 830.0 | 854.9 | 880.5 | 906.8 | 934.0 | 961.9 |
| Revenue Growth, % | 0 | 4.22 | 7.93 | 0.61139 | -0.47686 | 2.99 | 2.99 | 2.99 | 2.99 | 2.99 |
| EBITDA | 461.5 | 489.1 | 537.7 | 528.5 | 474.5 | 533.0 | 548.9 | 565.3 | 582.3 | 599.7 |
| EBITDA, % | 62.63 | 63.69 | 64.87 | 63.37 | 57.16 | 62.34 | 62.34 | 62.34 | 62.34 | 62.34 |
| Depreciation | 245.1 | 263.1 | 293.0 | 305.6 | 257.6 | 291.6 | 300.3 | 309.3 | 318.5 | 328.1 |
| Depreciation, % | 33.26 | 34.25 | 35.35 | 36.64 | 31.03 | 34.11 | 34.11 | 34.11 | 34.11 | 34.11 |
| EBIT | 216.4 | 226.0 | 244.7 | 222.9 | 216.9 | 241.4 | 248.6 | 256.1 | 263.7 | 271.6 |
| EBIT, % | 29.37 | 29.43 | 29.52 | 26.73 | 26.13 | 28.24 | 28.24 | 28.24 | 28.24 | 28.24 |
| Total Cash | 109.3 | 23.2 | 21.4 | 25.1 | 22.4 | 44.7 | 46.0 | 47.4 | 48.8 | 50.3 |
| Total Cash, percent | .0 | .0 | .0 | .0 | .0 | .0 | .0 | .0 | .0 | .0 |
| Account Receivables | 288.2 | 283.6 | 320.2 | 343.5 | 337.1 | 335.9 | 346.0 | 356.3 | 367.0 | 378.0 |
| Account Receivables, % | 39.11 | 36.92 | 38.63 | 41.19 | 40.62 | 39.29 | 39.29 | 39.29 | 39.29 | 39.29 |
| Inventories | 79.9 | 8.1 | 4.7 | .0 | .0 | 21.3 | 22.0 | 22.6 | 23.3 | 24.0 |
| Inventories, % | 10.85 | 1.05 | 0.57279 | 0 | 0 | 2.49 | 2.49 | 2.49 | 2.49 | 2.49 |
| Accounts Payable | 268.7 | 263.3 | 240.0 | 187.3 | 204.2 | 250.9 | 258.4 | 266.2 | 274.2 | 282.4 |
| Accounts Payable, % | 36.47 | 34.29 | 28.95 | 22.46 | 24.6 | 29.35 | 29.35 | 29.35 | 29.35 | 29.35 |
| Capital Expenditure | -2.4 | -142.1 | -.3 | -176.6 | .0 | -68.4 | -70.5 | -72.6 | -74.8 | -77.0 |
| Capital Expenditure, % | -0.32067 | -18.5 | -0.03184832 | -21.18 | 0 | -8 | -8 | -8 | -8 | -8 |
| Tax Rate, % | 1.92 | 1.92 | 1.92 | 1.92 | 1.92 | 1.92 | 1.92 | 1.92 | 1.92 | 1.92 |
| EBITAT | 210.1 | 219.0 | 237.4 | 219.1 | 212.7 | 235.3 | 242.3 | 249.6 | 257.0 | 264.7 |
| Depreciation | ||||||||||
| Changes in Account Receivables | ||||||||||
| Changes in Inventories | ||||||||||
| Changes in Accounts Payable | ||||||||||
| Capital Expenditure | ||||||||||
| UFCF | 353.4 | 411.1 | 473.5 | 276.8 | 493.5 | 485.1 | 468.9 | 483.0 | 497.4 | 512.3 |
| WACC, % | 6.91 | 6.91 | 6.91 | 6.94 | 6.94 | 6.92 | 6.92 | 6.92 | 6.92 | 6.92 |
| PV UFCF | ||||||||||
| SUM PV UFCF | 2,006.1 | |||||||||
| Long Term Growth Rate, % | 3.50 | |||||||||
| Free cash flow (T + 1) | 530 | |||||||||
| Terminal Value | 15,487 | |||||||||
| Present Terminal Value | 11,082 | |||||||||
| Enterprise Value | 13,088 | |||||||||
| Net Debt | 3,271 | |||||||||
| Equity Value | 9,817 | |||||||||
| Diluted Shares Outstanding, MM | 108 | |||||||||
| Equity Value Per Share | 90.63 |
What You Will Get
- Real HIW Financial Data: Pre-filled with Highwoods Properties’ historical and projected data for precise analysis.
- Fully Editable Template: Modify key inputs like revenue growth, WACC, and EBITDA % with ease.
- Automatic Calculations: See Highwoods Properties’ intrinsic value update instantly based on your changes.
- Professional Valuation Tool: Designed for investors, analysts, and consultants seeking accurate DCF results.
- User-Friendly Design: Simple structure and clear instructions for all experience levels.
Key Features
- Comprehensive HIW Data: Pre-loaded with Highwoods Properties' historical performance metrics and future outlooks.
- Fully Customizable Parameters: Modify rental growth, operating margins, cost of capital, tax implications, and capital investments.
- Adaptive Valuation Model: Instant updates to Net Present Value (NPV) and intrinsic value based on your adjustments.
- Scenario Analysis: Develop various projection scenarios to evaluate different valuation results.
- Intuitive Interface: Clear, organized, and tailored for both industry experts and newcomers.
How It Works
- Step 1: Download the Excel file.
- Step 2: Review pre-entered Highwoods Properties, Inc. (HIW) data (historical and projected).
- Step 3: Adjust key assumptions (yellow cells) based on your analysis.
- Step 4: View automatic recalculations for Highwoods Properties, Inc. (HIW)'s intrinsic value.
- Step 5: Use the outputs for investment decisions or reporting.
Why Choose This Calculator for Highwoods Properties, Inc. (HIW)?
- Comprehensive Tool: Features DCF, WACC, and financial ratio analyses tailored for the real estate sector.
- Customizable Inputs: Modify the highlighted cells to explore different investment scenarios.
- Detailed Insights: Automatically calculates Highwoods Properties' intrinsic value and Net Present Value.
- Preloaded Data: Historical and projected data provide reliable starting points for analysis.
- Professional Quality: Perfect for real estate analysts, investors, and property consultants.
Who Should Use Highwoods Properties, Inc. (HIW)?
- Real Estate Investors: Make informed decisions with a reliable resource for property valuation.
- Financial Analysts: Streamline your analysis with customizable financial models tailored for REITs.
- Consultants: Efficiently modify templates for client presentations or investment reports.
- Real Estate Enthusiasts: Enhance your knowledge of real estate investment strategies with practical examples.
- Educators and Students: Utilize as a valuable tool for learning in real estate and finance courses.
What the Template Contains
- Preloaded HIW Data: Historical and projected financial data, including revenue, EBIT, and capital expenditures.
- DCF and WACC Models: Professional-grade sheets for calculating intrinsic value and Weighted Average Cost of Capital.
- Editable Inputs: Yellow-highlighted cells for adjusting revenue growth, tax rates, and discount rates.
- Financial Statements: Comprehensive annual and quarterly financials for deeper analysis.
- Key Ratios: Profitability, leverage, and efficiency ratios to evaluate performance.
- Dashboard and Charts: Visual summaries of valuation outcomes and assumptions.
Disclaimer
All information, articles, and product details provided on this website are for general informational and educational purposes only. We do not claim any ownership over, nor do we intend to infringe upon, any trademarks, copyrights, logos, brand names, or other intellectual property mentioned or depicted on this site. Such intellectual property remains the property of its respective owners, and any references here are made solely for identification or informational purposes, without implying any affiliation, endorsement, or partnership.
We make no representations or warranties, express or implied, regarding the accuracy, completeness, or suitability of any content or products presented. Nothing on this website should be construed as legal, tax, investment, financial, medical, or other professional advice. In addition, no part of this site—including articles or product references—constitutes a solicitation, recommendation, endorsement, advertisement, or offer to buy or sell any securities, franchises, or other financial instruments, particularly in jurisdictions where such activity would be unlawful.
All content is of a general nature and may not address the specific circumstances of any individual or entity. It is not a substitute for professional advice or services. Any actions you take based on the information provided here are strictly at your own risk. You accept full responsibility for any decisions or outcomes arising from your use of this website and agree to release us from any liability in connection with your use of, or reliance upon, the content or products found herein.