
|
Hudson Global, Inc. (HSON) Valation DCF |
Entièrement Modifiable: Adapté À Vos Besoins Dans Excel Ou Sheets
Conception Professionnelle: Modèles Fiables Et Conformes Aux Normes Du Secteur
Pré-Construits Pour Une Utilisation Rapide Et Efficace
Compatible MAC/PC, entièrement débloqué
Aucune Expertise N'Est Requise; Facile À Suivre
Hudson Global, Inc. (HSON) Bundle
Évaluez les perspectives financières d'Hudson Global, Inc. comme un expert! Cette calculatrice (HSON) DCF est livrée avec des données financières pré-remplies et offre une pleine flexibilité pour modifier la croissance des revenus, le WACC, les marges et d'autres hypothèses cruciales pour s'aligner sur vos projections.
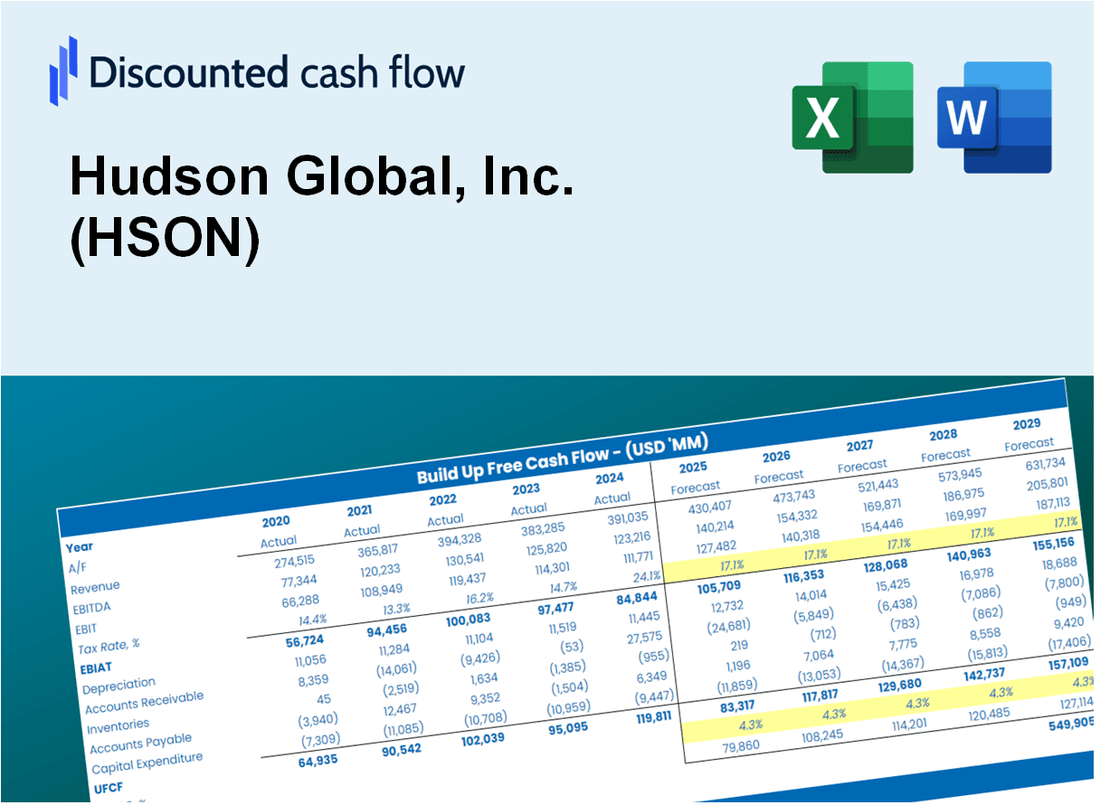
Discounted Cash Flow (DCF) - (USD MM)
| Year | AY1 2020 |
AY2 2021 |
AY3 2022 |
AY4 2023 |
AY5 2024 |
FY1 2025 |
FY2 2026 |
FY3 2027 |
FY4 2028 |
FY5 2029 |
|---|---|---|---|---|---|---|---|---|---|---|
| Revenue | 101.4 | 169.2 | 200.9 | 161.3 | 140.1 | 158.5 | 179.3 | 202.9 | 229.7 | 259.9 |
| Revenue Growth, % | 0 | 66.79 | 18.74 | -19.7 | -13.19 | 13.16 | 13.16 | 13.16 | 13.16 | 13.16 |
| EBITDA | -2.5 | 5.0 | 10.7 | 2.9 | -2.4 | 1.9 | 2.1 | 2.4 | 2.7 | 3.1 |
| EBITDA, % | -2.43 | 2.95 | 5.33 | 1.77 | -1.75 | 1.17 | 1.17 | 1.17 | 1.17 | 1.17 |
| Depreciation | .2 | .6 | 1.4 | 1.5 | 1.4 | 1.0 | 1.1 | 1.3 | 1.4 | 1.6 |
| Depreciation, % | 0.17645 | 0.35282 | 0.68586 | 0.90927 | 0.97175 | 0.61923 | 0.61923 | 0.61923 | 0.61923 | 0.61923 |
| EBIT | -2.6 | 4.4 | 9.3 | 1.4 | -3.8 | .9 | 1.0 | 1.1 | 1.3 | 1.4 |
| EBIT, % | -2.61 | 2.6 | 4.65 | 0.85721 | -2.72 | 0.55467 | 0.55467 | 0.55467 | 0.55467 | 0.55467 |
| Total Cash | 25.8 | 21.7 | 27.1 | 22.6 | 17.0 | 24.7 | 28.0 | 31.6 | 35.8 | 40.5 |
| Total Cash, percent | .0 | .0 | .0 | .0 | .0 | .0 | .0 | .0 | .0 | .0 |
| Account Receivables | 13.4 | 25.7 | 26.3 | 19.7 | 20.1 | 21.6 | 24.4 | 27.6 | 31.3 | 35.4 |
| Account Receivables, % | 13.25 | 15.22 | 13.08 | 12.22 | 14.35 | 13.62 | 13.62 | 13.62 | 13.62 | 13.62 |
| Inventories | .0 | .0 | .2 | .0 | .0 | .0 | .0 | .0 | .0 | .0 |
| Inventories, % | 0 | 0 | 0.07963487 | 0 | 0 | 0.01592697 | 0.01592697 | 0.01592697 | 0.01592697 | 0.01592697 |
| Accounts Payable | .6 | .9 | 1.7 | .9 | 1.8 | 1.2 | 1.3 | 1.5 | 1.7 | 1.9 |
| Accounts Payable, % | 0.56778 | 0.51475 | 0.83517 | 0.538 | 1.28 | 0.74661 | 0.74661 | 0.74661 | 0.74661 | 0.74661 |
| Capital Expenditure | .0 | -.3 | -.5 | -.1 | .0 | -.2 | -.2 | -.2 | -.2 | -.3 |
| Capital Expenditure, % | -0.02168599 | -0.16784 | -0.25085 | -0.06136186 | -0.012852 | -0.10292 | -0.10292 | -0.10292 | -0.10292 | -0.10292 |
| Tax Rate, % | -37.46 | -37.46 | -37.46 | -37.46 | -37.46 | -37.46 | -37.46 | -37.46 | -37.46 | -37.46 |
| EBITAT | -4.6 | 3.3 | 7.0 | 1.2 | -5.2 | .8 | .9 | 1.0 | 1.1 | 1.3 |
| Depreciation | ||||||||||
| Changes in Account Receivables | ||||||||||
| Changes in Inventories | ||||||||||
| Changes in Accounts Payable | ||||||||||
| Capital Expenditure | ||||||||||
| UFCF | -17.4 | -8.4 | 8.0 | 8.5 | -3.4 | -.5 | -.9 | -1.0 | -1.1 | -1.3 |
| WACC, % | 5.35 | 5.31 | 5.31 | 5.33 | 5.35 | 5.33 | 5.33 | 5.33 | 5.33 | 5.33 |
| PV UFCF | ||||||||||
| SUM PV UFCF | -4.1 | |||||||||
| Long Term Growth Rate, % | 1.00 | |||||||||
| Free cash flow (T + 1) | -1 | |||||||||
| Terminal Value | -30 | |||||||||
| Present Terminal Value | -23 | |||||||||
| Enterprise Value | -28 | |||||||||
| Net Debt | -16 | |||||||||
| Equity Value | -12 | |||||||||
| Diluted Shares Outstanding, MM | 3 | |||||||||
| Equity Value Per Share | -3.85 |
What You Will Receive
- Comprehensive Financial Model: Hudson Global’s actual data facilitates accurate DCF valuation.
- Complete Forecast Control: Modify revenue growth, profit margins, WACC, and other essential factors.
- Real-Time Calculations: Automatic updates allow you to view results instantly as you make adjustments.
- Professional-Grade Template: A polished Excel file crafted for high-quality valuation presentations.
- Flexible and Reusable: Designed for adaptability, enabling multiple applications for in-depth forecasts.
Key Features
- Comprehensive Hudson Global Financials: Gain access to precise pre-loaded historical data and future forecasts for Hudson Global, Inc. (HSON).
- Tailorable Forecast Parameters: Modify the yellow-highlighted fields such as WACC, growth rates, and profit margins.
- Real-Time Calculations: Instant updates to DCF, Net Present Value (NPV), and cash flow evaluations.
- User-Friendly Dashboard: Clear charts and summaries to effectively visualize your valuation outcomes.
- Suitable for All Experience Levels: An easy-to-navigate design crafted for investors, CFOs, and consultants alike.
How It Works
- Download: Obtain the pre-built Excel file featuring Hudson Global, Inc. (HSON) financial data.
- Customize: Modify forecasts such as revenue growth, EBITDA %, and WACC to fit your analysis.
- Update Automatically: The intrinsic value and NPV calculations refresh in real-time as you make changes.
- Test Scenarios: Generate various projections and evaluate results instantly.
- Make Decisions: Leverage the valuation findings to inform your investment choices.
Why Choose Hudson Global, Inc. (HSON)?
- Streamlined Processes: No need to start from scratch – our solutions are ready for immediate implementation.
- Enhanced Precision: Our reliable data and methodologies minimize the risk of errors.
- Fully Adaptable: Customize our offerings to align with your specific needs and forecasts.
- User-Friendly Insights: Intuitive visuals and outputs simplify the analysis of results.
- Preferred by Professionals: Crafted for experts who prioritize accuracy and ease of use.
Who Should Use Hudson Global, Inc. (HSON)?
- Professional Recruiters: Leverage advanced tools to enhance talent acquisition strategies.
- Human Resource Teams: Evaluate recruitment metrics to optimize workforce planning.
- Consultants and Advisors: Offer clients expert insights into market trends in recruitment and staffing.
- Students and Educators: Utilize case studies to learn about recruitment processes and workforce dynamics.
- Business Analysts: Analyze industry benchmarks to assess the performance of staffing solutions.
What the Template Contains
- Operating and Balance Sheet Data: Pre-filled Hudson Global, Inc. (HSON) historical data and forecasts, including revenue, EBITDA, EBIT, and capital expenditures.
- WACC Calculation: A dedicated sheet for Weighted Average Cost of Capital (WACC), including parameters like Beta, risk-free rate, and share price.
- DCF Valuation (Unlevered and Levered): Editable Discounted Cash Flow models showing intrinsic value with detailed calculations.
- Financial Statements: Pre-loaded financial statements (annual and quarterly) to support analysis.
- Key Ratios: Includes profitability, leverage, and efficiency ratios for Hudson Global, Inc. (HSON).
- Dashboard and Charts: Visual summary of valuation outputs and assumptions to analyze results easily.
Disclaimer
All information, articles, and product details provided on this website are for general informational and educational purposes only. We do not claim any ownership over, nor do we intend to infringe upon, any trademarks, copyrights, logos, brand names, or other intellectual property mentioned or depicted on this site. Such intellectual property remains the property of its respective owners, and any references here are made solely for identification or informational purposes, without implying any affiliation, endorsement, or partnership.
We make no representations or warranties, express or implied, regarding the accuracy, completeness, or suitability of any content or products presented. Nothing on this website should be construed as legal, tax, investment, financial, medical, or other professional advice. In addition, no part of this site—including articles or product references—constitutes a solicitation, recommendation, endorsement, advertisement, or offer to buy or sell any securities, franchises, or other financial instruments, particularly in jurisdictions where such activity would be unlawful.
All content is of a general nature and may not address the specific circumstances of any individual or entity. It is not a substitute for professional advice or services. Any actions you take based on the information provided here are strictly at your own risk. You accept full responsibility for any decisions or outcomes arising from your use of this website and agree to release us from any liability in connection with your use of, or reliance upon, the content or products found herein.