
|
Horizon Technology Finance Corp (HTFC) Évaluation DCF |
Entièrement Modifiable: Adapté À Vos Besoins Dans Excel Ou Sheets
Conception Professionnelle: Modèles Fiables Et Conformes Aux Normes Du Secteur
Pré-Construits Pour Une Utilisation Rapide Et Efficace
Compatible MAC/PC, entièrement débloqué
Aucune Expertise N'Est Requise; Facile À Suivre
Horizon Technology Finance Corp (HTFC) Bundle
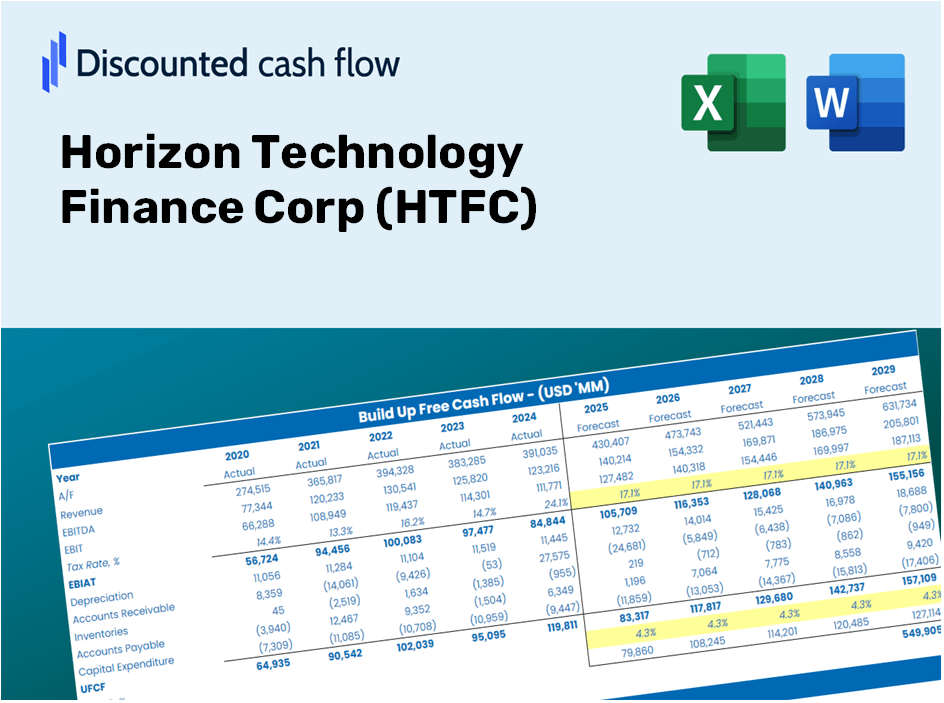
Gardez un aperçu de votre analyse d'évaluation Horizon Technology Finance Corp (HTFC) à l'aide de notre calculatrice sophistiquée DCF! Ce modèle Excel est préchargé avec de vraies données HTFC, vous permettant d'ajuster les prévisions et les hypothèses pour déterminer avec précision la valeur intrinsèque de Horizon Technology Finance Corp.
Discounted Cash Flow (DCF) - (USD MM)
| Year | AY1 2020 |
AY2 2021 |
AY3 2022 |
AY4 2023 |
AY5 2024 |
FY1 2025 |
FY2 2026 |
FY3 2027 |
FY4 2028 |
FY5 2029 |
|---|---|---|---|---|---|---|---|---|---|---|
| Revenue | 46.0 | 60.0 | 79.2 | 113.5 | 99.9 | 123.3 | 152.2 | 187.8 | 231.8 | 286.1 |
| Revenue Growth, % | 0 | 30.37 | 31.95 | 43.29 | -11.95 | 23.42 | 23.42 | 23.42 | 23.42 | 23.42 |
| EBITDA | 16.0 | 40.2 | 21.9 | 11.9 | 26.6 | 41.1 | 50.7 | 62.6 | 77.2 | 95.3 |
| EBITDA, % | 34.84 | 67 | 27.61 | 10.52 | 26.65 | 33.32 | 33.32 | 33.32 | 33.32 | 33.32 |
| Depreciation | .0 | 16.6 | 29.4 | -91.9 | .0 | -4.0 | -5.0 | -6.1 | -7.6 | -9.3 |
| Depreciation, % | 0 | 27.59 | 37.07 | -80.99 | 0 | -3.27 | -3.27 | -3.27 | -3.27 | -3.27 |
| EBIT | 16.0 | 23.7 | -7.5 | 103.8 | 26.6 | 45.1 | 55.7 | 68.7 | 84.8 | 104.7 |
| EBIT, % | 34.84 | 39.42 | -9.46 | 91.51 | 26.65 | 36.59 | 36.59 | 36.59 | 36.59 | 36.59 |
| Total Cash | .0 | 38.1 | 20.6 | 46.6 | 70.3 | 49.5 | 61.1 | 75.4 | 93.1 | 114.9 |
| Total Cash, percent | .0 | .0 | .0 | .0 | .0 | .0 | .0 | .0 | .0 | .0 |
| Account Receivables | 4.9 | 6.2 | 13.6 | 13.9 | 16.6 | 16.5 | 20.4 | 25.2 | 31.1 | 38.3 |
| Account Receivables, % | 10.74 | 10.25 | 17.14 | 12.27 | 16.57 | 13.4 | 13.4 | 13.4 | 13.4 | 13.4 |
| Inventories | .0 | .0 | .0 | .0 | .0 | .0 | .0 | .0 | .0 | .0 |
| Inventories, % | 0 | 0 | 0 | 0 | 0 | 0 | 0 | 0 | 0 | 0 |
| Accounts Payable | 5.8 | 6.4 | 9.2 | 11.0 | 13.2 | 14.2 | 17.5 | 21.6 | 26.7 | 33.0 |
| Accounts Payable, % | 12.57 | 10.61 | 11.57 | 9.7 | 13.17 | 11.52 | 11.52 | 11.52 | 11.52 | 11.52 |
| Capital Expenditure | .0 | .0 | .0 | .0 | .0 | .0 | .0 | .0 | .0 | .0 |
| Capital Expenditure, % | 0 | 0 | 0 | 0 | 0 | 0 | 0 | 0 | 0 | 0 |
| Tax Rate, % | 111.44 | 111.44 | 111.44 | 111.44 | 111.44 | 111.44 | 111.44 | 111.44 | 111.44 | 111.44 |
| EBITAT | 15.5 | 23.3 | -7.2 | 113.7 | -3.0 | 35.4 | 43.7 | 53.9 | 66.5 | 82.1 |
| Depreciation | ||||||||||
| Changes in Account Receivables | ||||||||||
| Changes in Inventories | ||||||||||
| Changes in Accounts Payable | ||||||||||
| Capital Expenditure | ||||||||||
| UFCF | 16.3 | 39.2 | 17.5 | 23.3 | -3.5 | 32.4 | 38.1 | 47.1 | 58.1 | 71.7 |
| WACC, % | 7.24 | 7.32 | 7.24 | 7.39 | 2.79 | 6.4 | 6.4 | 6.4 | 6.4 | 6.4 |
| PV UFCF | ||||||||||
| SUM PV UFCF | 201.2 | |||||||||
| Long Term Growth Rate, % | 2.00 | |||||||||
| Free cash flow (T + 1) | 73 | |||||||||
| Terminal Value | 1,663 | |||||||||
| Present Terminal Value | 1,220 | |||||||||
| Enterprise Value | 1,421 | |||||||||
| Net Debt | 398 | |||||||||
| Equity Value | 1,023 | |||||||||
| Diluted Shares Outstanding, MM | 36 | |||||||||
| Equity Value Per Share | 28.34 |
What You Will Receive
- Accurate HTFC Financials: Access to both historical and projected data for precise valuation.
- Customizable Parameters: Adjust WACC, tax rates, revenue growth, and capital expenditure figures.
- Real-Time Calculations: Intrinsic value and NPV are updated automatically.
- Comprehensive Scenario Analysis: Explore various scenarios to assess the future performance of Horizon Technology Finance Corp (HTFC).
- User-Friendly Interface: Designed for professionals while remaining easy to navigate for newcomers.
Key Features
- Pre-Loaded Data: Historical financial statements and pre-filled forecasts for Horizon Technology Finance Corp (HTFC).
- Fully Adjustable Inputs: Modify WACC, tax rates, revenue growth, and EBITDA margins as needed.
- Instant Results: Watch the intrinsic value of Horizon Technology Finance Corp (HTFC) recalculate in real time.
- Clear Visual Outputs: Dashboard charts present valuation results and essential metrics clearly.
- Built for Accuracy: A professional-grade tool tailored for analysts, investors, and financial experts.
How It Works
- 1. Access the Template: Download and open the Excel file featuring Horizon Technology Finance Corp (HTFC) preloaded data.
- 2. Adjust Assumptions: Modify critical inputs such as growth rates, WACC, and capital expenditures.
- 3. View Results in Real-Time: The DCF model automatically calculates the intrinsic value and NPV based on your inputs.
- 4. Explore Different Scenarios: Evaluate various forecasts to understand different valuation results.
- 5. Present with Assurance: Share professional valuation analyses to bolster your decision-making process.
Why Opt for This Calculator?
- Precise Information: Utilizing real Horizon Technology Finance Corp (HTFC) financial data ensures trustworthy valuation outcomes.
- Flexible: Modify essential parameters such as growth rates, WACC, and tax rates to align with your forecasts.
- Efficient: Pre-configured calculations save you the effort of starting from the ground up.
- Professional Quality: Tailored for investors, analysts, and consultants in the industry.
- Easy to Use: A user-friendly interface with clear instructions ensures accessibility for all users.
Who Can Benefit from Horizon Technology Finance Corp (HTFC)?
- Investors: Empower your investment choices with a professional valuation tool designed for precision.
- Financial Analysts: Streamline your workflow with a customizable pre-built DCF model.
- Consultants: Effortlessly modify the template for effective client presentations and reports.
- Finance Enthusiasts: Enhance your knowledge of valuation methodologies through practical, real-world applications.
- Educators and Students: Utilize this resource as a hands-on learning aid in finance courses.
Overview of the Template Contents
- Historical Data: Provides a comprehensive look at Horizon Technology Finance Corp's (HTFC) previous financial performance and baseline projections.
- DCF and Levered DCF Models: Detailed templates designed to assess the intrinsic value of Horizon Technology Finance Corp (HTFC).
- WACC Sheet: Pre-configured calculations for the Weighted Average Cost of Capital tailored for Horizon Technology Finance Corp (HTFC).
- Editable Inputs: Customize key variables such as growth rates, EBITDA percentages, and CAPEX assumptions.
- Quarterly and Annual Statements: A thorough analysis of Horizon Technology Finance Corp's (HTFC) financials.
- Interactive Dashboard: Dive into dynamic visualizations of valuation outcomes and forecasts.
Disclaimer
All information, articles, and product details provided on this website are for general informational and educational purposes only. We do not claim any ownership over, nor do we intend to infringe upon, any trademarks, copyrights, logos, brand names, or other intellectual property mentioned or depicted on this site. Such intellectual property remains the property of its respective owners, and any references here are made solely for identification or informational purposes, without implying any affiliation, endorsement, or partnership.
We make no representations or warranties, express or implied, regarding the accuracy, completeness, or suitability of any content or products presented. Nothing on this website should be construed as legal, tax, investment, financial, medical, or other professional advice. In addition, no part of this site—including articles or product references—constitutes a solicitation, recommendation, endorsement, advertisement, or offer to buy or sell any securities, franchises, or other financial instruments, particularly in jurisdictions where such activity would be unlawful.
All content is of a general nature and may not address the specific circumstances of any individual or entity. It is not a substitute for professional advice or services. Any actions you take based on the information provided here are strictly at your own risk. You accept full responsibility for any decisions or outcomes arising from your use of this website and agree to release us from any liability in connection with your use of, or reliance upon, the content or products found herein.