
|
Hyzon Motors Inc. (Hyzn) Valation DCF |
Entièrement Modifiable: Adapté À Vos Besoins Dans Excel Ou Sheets
Conception Professionnelle: Modèles Fiables Et Conformes Aux Normes Du Secteur
Pré-Construits Pour Une Utilisation Rapide Et Efficace
Compatible MAC/PC, entièrement débloqué
Aucune Expertise N'Est Requise; Facile À Suivre
Hyzon Motors Inc. (HYZN) Bundle
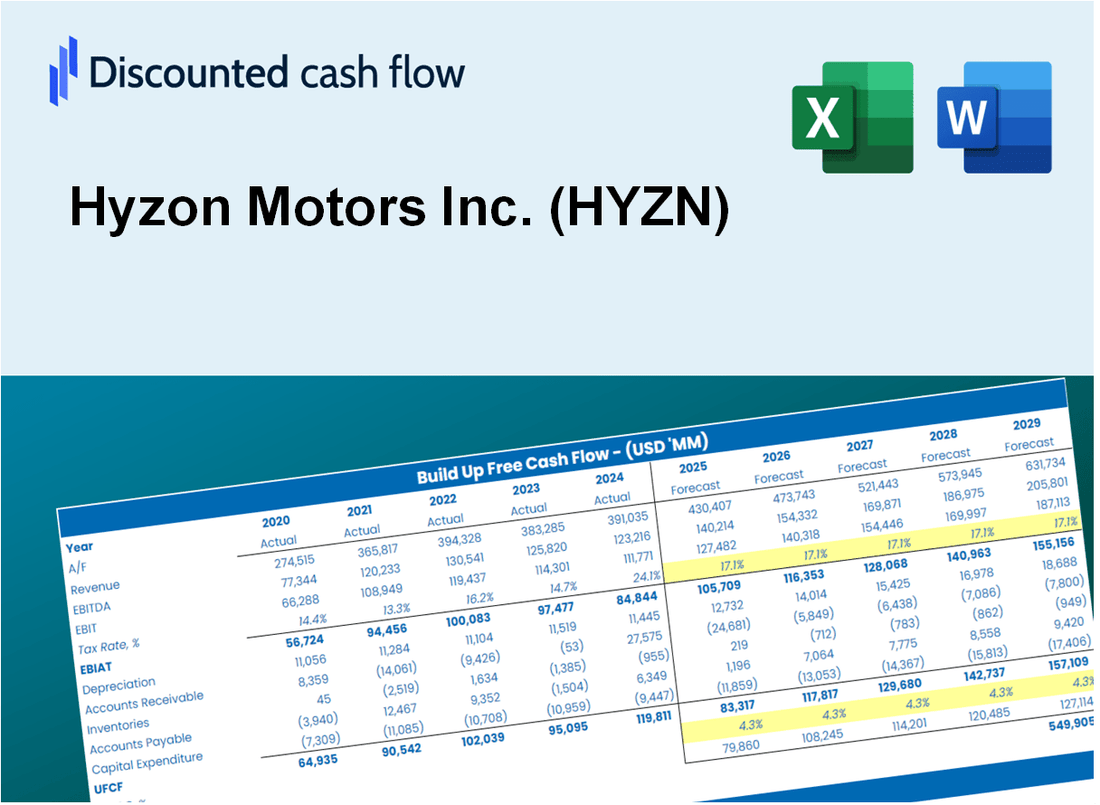
Simplifiez l'évaluation de Hyzon Motors Inc. (HYZN) avec cette calculatrice DCF personnalisable! Doté de Real Hyzon Motors Inc. (HYZN) Financials and Rajustement des intrants de prévision, vous pouvez tester les scénarios et découvrir la juste valeur de Hyzon Motors Inc. (HYZN) en minutes.
Discounted Cash Flow (DCF) - (USD MM)
| Year | AY1 2019 |
AY2 2020 |
AY3 2021 |
AY4 2022 |
AY5 2023 |
FY1 2024 |
FY2 2025 |
FY3 2026 |
FY4 2027 |
FY5 2028 |
|---|---|---|---|---|---|---|---|---|---|---|
| Revenue | .0 | .0 | 6.0 | 3.7 | .3 | .2 | .1 | .1 | .1 | .0 |
| Revenue Growth, % | 0 | 0 | 0 | -38.4 | -92.08 | -32.62 | -32.62 | -32.62 | -32.62 | -32.62 |
| EBITDA | -.2 | -14.2 | -97.9 | -172.8 | -180.5 | .0 | .0 | .0 | .0 | .0 |
| EBITDA, % | 100 | 100 | -1618.25 | -4637.65 | -61200.34 | -20 | -20 | -20 | -20 | -20 |
| Depreciation | .2 | .2 | 1.1 | 3.7 | 4.0 | .2 | .1 | .1 | .1 | .0 |
| Depreciation, % | 100 | 100 | 18.85 | 99.41 | 1348.14 | 83.65 | 83.65 | 83.65 | 83.65 | 83.65 |
| EBIT | -.4 | -14.3 | -99.0 | -176.5 | -184.5 | .0 | .0 | .0 | .0 | .0 |
| EBIT, % | 100 | 100 | -1637.1 | -4737.06 | -62548.47 | -20 | -20 | -20 | -20 | -20 |
| Total Cash | .3 | 17.1 | 445.1 | 255.3 | 112.3 | .2 | .1 | .1 | .1 | .0 |
| Total Cash, percent | .0 | .0 | .0 | .0 | .0 | .0 | .0 | .0 | .0 | .0 |
| Account Receivables | .0 | .0 | 5.4 | 8.5 | 2.5 | .2 | .1 | .1 | .1 | .0 |
| Account Receivables, % | 100 | 100 | 88.92 | 227.94 | 833.9 | 97.78 | 97.78 | 97.78 | 97.78 | 97.78 |
| Inventories | .0 | .6 | 19.2 | 35.6 | 28.8 | .2 | .1 | .1 | .1 | .0 |
| Inventories, % | 100 | 100 | 318.15 | 954.19 | 9766.44 | 100 | 100 | 100 | 100 | 100 |
| Accounts Payable | .0 | .2 | 8.0 | 13.8 | 1.5 | .2 | .1 | .1 | .1 | .0 |
| Accounts Payable, % | 100 | 100 | 131.92 | 370.32 | 501.36 | 100 | 100 | 100 | 100 | 100 |
| Capital Expenditure | .0 | -.4 | -18.8 | -14.1 | -7.8 | -.1 | -.1 | -.1 | .0 | .0 |
| Capital Expenditure, % | 100 | 100 | -310.5 | -379.31 | -2660.68 | -60 | -60 | -60 | -60 | -60 |
| Tax Rate, % | 0.25797 | 0.25797 | 0.25797 | 0.25797 | 0.25797 | 0.25797 | 0.25797 | 0.25797 | 0.25797 | 0.25797 |
| EBITAT | -.4 | -14.3 | 356.3 | -178.2 | -184.0 | .0 | .0 | .0 | .0 | .0 |
| Depreciation | ||||||||||
| Changes in Account Receivables | ||||||||||
| Changes in Inventories | ||||||||||
| Changes in Accounts Payable | ||||||||||
| Capital Expenditure | ||||||||||
| UFCF | -.2 | -14.9 | 322.4 | -202.3 | -187.5 | 29.6 | .1 | .0 | .0 | .0 |
| WACC, % | 17.72 | 17.72 | 17.6 | 17.72 | 17.72 | 17.7 | 17.7 | 17.7 | 17.7 | 17.7 |
| PV UFCF | ||||||||||
| SUM PV UFCF | 25.3 | |||||||||
| Long Term Growth Rate, % | 2.00 | |||||||||
| Free cash flow (T + 1) | 0 | |||||||||
| Terminal Value | 0 | |||||||||
| Present Terminal Value | 0 | |||||||||
| Enterprise Value | 25 | |||||||||
| Net Debt | -105 | |||||||||
| Equity Value | 130 | |||||||||
| Diluted Shares Outstanding, MM | 245 | |||||||||
| Equity Value Per Share | 0.53 |
What You Will Get
- Real Hyzon Data: Preloaded financials – from revenue to EBIT – based on actual and projected figures for Hyzon Motors Inc. (HYZN).
- Full Customization: Adjust all critical parameters (yellow cells) like WACC, growth %, and tax rates to fit your analysis.
- Instant Valuation Updates: Automatic recalculations to assess the impact of changes on Hyzon Motors Inc.'s (HYZN) fair value.
- Versatile Excel Template: Designed for quick edits, scenario testing, and in-depth projections tailored for Hyzon Motors Inc. (HYZN).
- Time-Saving and Accurate: Avoid the hassle of building models from scratch while ensuring precision and flexibility.
Key Features
- Comprehensive DCF Calculator: Features detailed unlevered and levered DCF valuation models tailored for Hyzon Motors Inc. (HYZN).
- WACC Calculator: Pre-configured Weighted Average Cost of Capital sheet with adjustable inputs specific to Hyzon Motors Inc. (HYZN).
- Customizable Forecast Assumptions: Easily adjust growth rates, capital expenditures, and discount rates for accurate projections.
- Integrated Financial Ratios: Evaluate profitability, leverage, and efficiency ratios pertinent to Hyzon Motors Inc. (HYZN).
- Interactive Dashboard and Charts: Visual representations highlight key valuation metrics for straightforward analysis.
How It Works
- Step 1: Download the Excel file.
- Step 2: Review pre-entered Hyzon Motors data (historical and projected).
- Step 3: Adjust key assumptions (yellow cells) based on your analysis.
- Step 4: View automatic recalculations for Hyzon Motors’ intrinsic value.
- Step 5: Use the outputs for investment decisions or reporting.
Why Choose This Calculator for Hyzon Motors Inc. (HYZN)?
- Accuracy: Utilizes real Hyzon Motors financial data for precise calculations.
- Flexibility: Allows users to easily test and adjust inputs as needed.
- Time-Saving: Eliminate the tedious process of creating a DCF model from the ground up.
- Professional-Grade: Crafted with the expertise and usability expected by CFOs.
- User-Friendly: Intuitive interface suitable for users with varying levels of financial modeling expertise.
Who Should Use This Product?
- Investors: Assess Hyzon Motors Inc.'s (HYZN) market potential before making investment decisions.
- CFOs and Financial Analysts: Optimize valuation methodologies and evaluate financial forecasts.
- Startup Founders: Understand the valuation strategies of innovative companies like Hyzon Motors Inc.
- Consultants: Create detailed valuation reports to support client needs.
- Students and Educators: Utilize real-time data to learn and teach valuation principles.
What the Template Contains
- Pre-Filled DCF Model: Hyzon Motors Inc.'s (HYZN) financial data preloaded for immediate use.
- WACC Calculator: Detailed calculations for Weighted Average Cost of Capital.
- Financial Ratios: Evaluate Hyzon Motors Inc.'s (HYZN) profitability, leverage, and efficiency.
- Editable Inputs: Change assumptions such as growth, margins, and CAPEX to fit your scenarios.
- Financial Statements: Annual and quarterly reports to support detailed analysis.
- Interactive Dashboard: Easily visualize key valuation metrics and results.
Disclaimer
All information, articles, and product details provided on this website are for general informational and educational purposes only. We do not claim any ownership over, nor do we intend to infringe upon, any trademarks, copyrights, logos, brand names, or other intellectual property mentioned or depicted on this site. Such intellectual property remains the property of its respective owners, and any references here are made solely for identification or informational purposes, without implying any affiliation, endorsement, or partnership.
We make no representations or warranties, express or implied, regarding the accuracy, completeness, or suitability of any content or products presented. Nothing on this website should be construed as legal, tax, investment, financial, medical, or other professional advice. In addition, no part of this site—including articles or product references—constitutes a solicitation, recommendation, endorsement, advertisement, or offer to buy or sell any securities, franchises, or other financial instruments, particularly in jurisdictions where such activity would be unlawful.
All content is of a general nature and may not address the specific circumstances of any individual or entity. It is not a substitute for professional advice or services. Any actions you take based on the information provided here are strictly at your own risk. You accept full responsibility for any decisions or outcomes arising from your use of this website and agree to release us from any liability in connection with your use of, or reliance upon, the content or products found herein.