
|
Investcorp Credit Management BDC, Inc. (ICMB) Évaluation DCF |
Entièrement Modifiable: Adapté À Vos Besoins Dans Excel Ou Sheets
Conception Professionnelle: Modèles Fiables Et Conformes Aux Normes Du Secteur
Pré-Construits Pour Une Utilisation Rapide Et Efficace
Compatible MAC/PC, entièrement débloqué
Aucune Expertise N'Est Requise; Facile À Suivre
Investcorp Credit Management BDC, Inc. (ICMB) Bundle
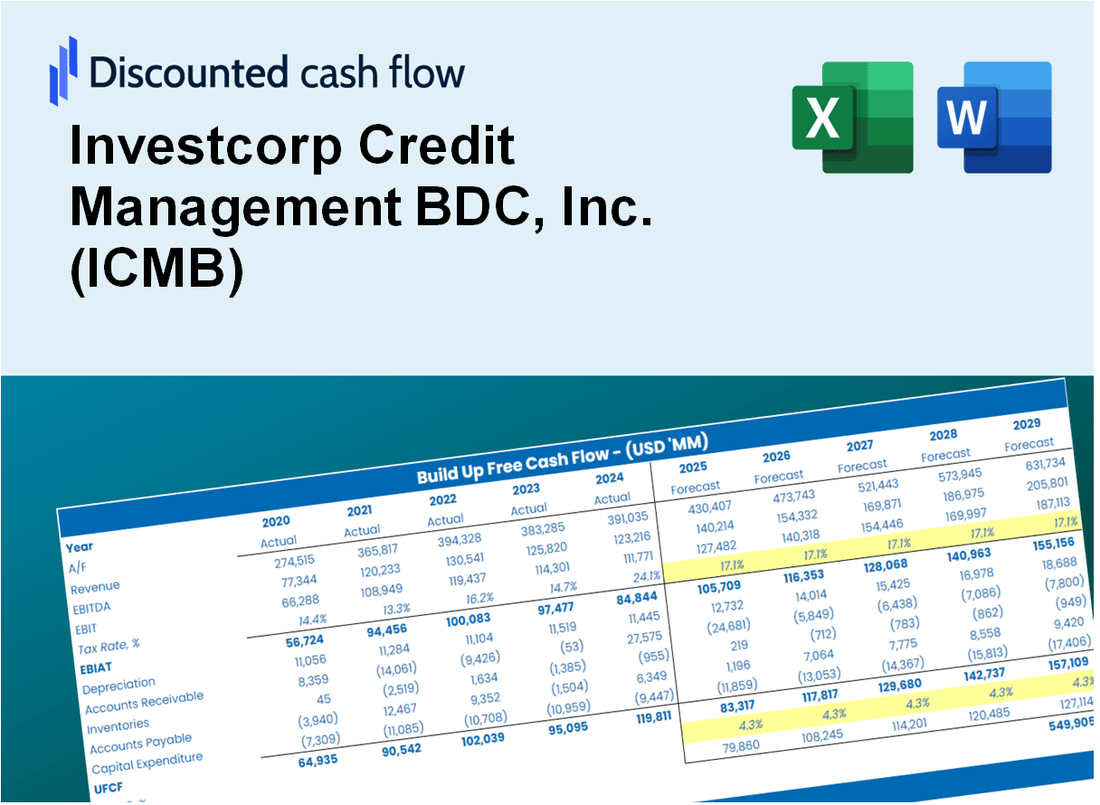
Simplifiez l'évaluation Investcorp Credit Management BDC, Inc. (ICMB) avec cette calculatrice DCF personnalisable! Doté de Real Investcorp Credit Management BDC, Inc. (ICMB) Financials and Adjustable Forecast Intarts, vous pouvez tester les scénarios et découvrir la juste valeur de la gestion du crédit à Credit BDC, Inc. (ICMB) en procès-verbal.
What You Will Get
- Real ICMB Data: Preloaded financials – from revenue to EBIT – based on actual and projected figures.
- Full Customization: Adjust all critical parameters (yellow cells) like WACC, growth %, and tax rates.
- Instant Valuation Updates: Automatic recalculations to analyze the impact of changes on ICMB’s fair value.
- Versatile Excel Template: Tailored for quick edits, scenario testing, and detailed projections.
- Time-Saving and Accurate: Skip building models from scratch while maintaining precision and flexibility.
Key Features
- 🔍 Real-Life ICMB Financials: Pre-filled historical and projected data for Investcorp Credit Management BDC, Inc. (ICMB).
- ✏️ Fully Customizable Inputs: Adjust all critical parameters (yellow cells) like WACC, growth %, and tax rates.
- 📊 Professional DCF Valuation: Built-in formulas calculate ICMB’s intrinsic value using the Discounted Cash Flow method.
- ⚡ Instant Results: Visualize ICMB’s valuation instantly after making changes.
- Scenario Analysis: Test and compare outcomes for various financial assumptions side-by-side.
How It Works
- Step 1: Download the prebuilt Excel template featuring Investcorp Credit Management BDC, Inc.'s (ICMB) data.
- Step 2: Review the pre-filled sheets to familiarize yourself with the essential metrics.
- Step 3: Adjust forecasts and assumptions in the editable yellow cells (WACC, growth, margins).
- Step 4: Instantly see recalculated results, including the intrinsic value of Investcorp Credit Management BDC, Inc. (ICMB).
- Step 5: Make well-informed investment decisions or create reports based on the outputs.
Why Choose Investcorp Credit Management BDC, Inc. (ICMB)?
- All-in-One Solution: Offers a comprehensive suite of investment analysis tools tailored for credit management.
- Flexible Parameters: Modify highlighted fields to explore different investment scenarios.
- In-Depth Analysis: Automatically computes intrinsic value and Net Present Value for informed decision-making.
- Comprehensive Data: Access to both historical and projected data for reliable analysis.
- Expert-Level Resources: Perfect for financial professionals, investors, and credit management consultants.
Who Should Use This Product?
- Institutional Investors: Develop comprehensive and trustworthy valuation models for portfolio management of Investcorp Credit Management BDC, Inc. (ICMB).
- Corporate Finance Professionals: Evaluate valuation scenarios to inform strategic decisions within their organizations.
- Financial Consultants and Advisors: Offer clients precise valuation insights related to Investcorp Credit Management BDC, Inc. (ICMB).
- Students and Academic Instructors: Utilize real-world data to enhance learning and practice in financial modeling.
- Investment Enthusiasts: Gain insights into the valuation processes of credit management firms like Investcorp Credit Management BDC, Inc. (ICMB).
What the Template Contains
- Pre-Filled Data: Includes Investcorp Credit Management BDC, Inc. (ICMB)'s historical financials and forecasts.
- Discounted Cash Flow Model: Editable DCF valuation model with automatic calculations tailored for (ICMB).
- Weighted Average Cost of Capital (WACC): A dedicated sheet for calculating WACC based on custom inputs specific to (ICMB).
- Key Financial Ratios: Analyze (ICMB)'s profitability, efficiency, and leverage metrics.
- Customizable Inputs: Easily edit revenue growth, margins, and tax rates for (ICMB).
- Clear Dashboard: Visualizations and tables summarizing key valuation results for (ICMB).
Disclaimer
All information, articles, and product details provided on this website are for general informational and educational purposes only. We do not claim any ownership over, nor do we intend to infringe upon, any trademarks, copyrights, logos, brand names, or other intellectual property mentioned or depicted on this site. Such intellectual property remains the property of its respective owners, and any references here are made solely for identification or informational purposes, without implying any affiliation, endorsement, or partnership.
We make no representations or warranties, express or implied, regarding the accuracy, completeness, or suitability of any content or products presented. Nothing on this website should be construed as legal, tax, investment, financial, medical, or other professional advice. In addition, no part of this site—including articles or product references—constitutes a solicitation, recommendation, endorsement, advertisement, or offer to buy or sell any securities, franchises, or other financial instruments, particularly in jurisdictions where such activity would be unlawful.
All content is of a general nature and may not address the specific circumstances of any individual or entity. It is not a substitute for professional advice or services. Any actions you take based on the information provided here are strictly at your own risk. You accept full responsibility for any decisions or outcomes arising from your use of this website and agree to release us from any liability in connection with your use of, or reliance upon, the content or products found herein.