
|
IMCD N.V. (IMCD.AS) Évaluation DCF |
Entièrement Modifiable: Adapté À Vos Besoins Dans Excel Ou Sheets
Conception Professionnelle: Modèles Fiables Et Conformes Aux Normes Du Secteur
Pré-Construits Pour Une Utilisation Rapide Et Efficace
Compatible MAC/PC, entièrement débloqué
Aucune Expertise N'Est Requise; Facile À Suivre
IMCD N.V. (IMCD.AS) Bundle
Vous cherchez à déterminer la valeur intrinsèque d'IMCD n.v.? Notre calculatrice IMCDAS DCF intègre des données réelles avec des fonctionnalités de personnalisation complètes, vous permettant d'ajuster les prévisions et d'améliorer vos stratégies d'investissement.
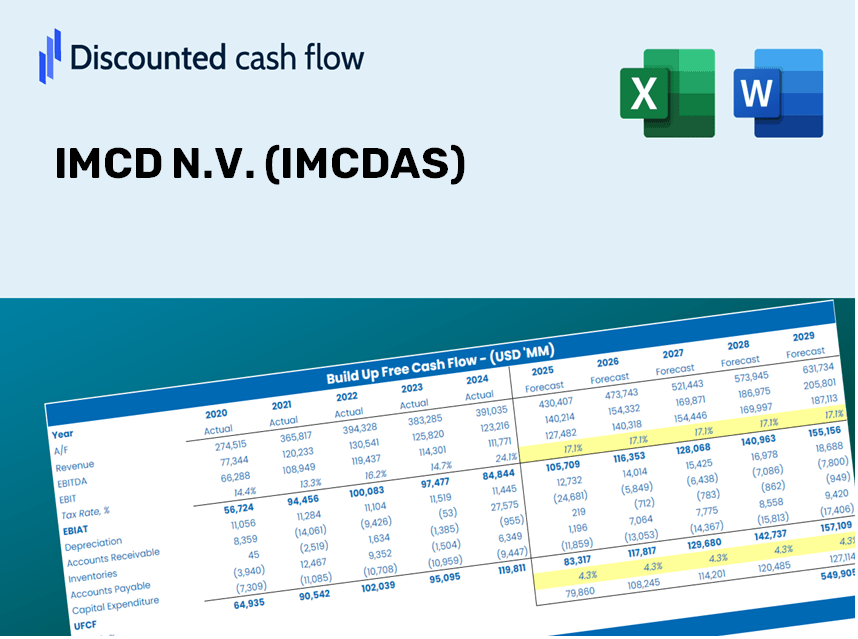
Discounted Cash Flow (DCF) - (USD MM)
| Year | AY1 2020 |
AY2 2021 |
AY3 2022 |
AY4 2023 |
AY5 2024 |
FY1 2025 |
FY2 2026 |
FY3 2027 |
FY4 2028 |
FY5 2029 |
|---|---|---|---|---|---|---|---|---|---|---|
| Revenue | 2,774.9 | 3,435.2 | 4,601.5 | 4,442.6 | 4,727.6 | 4,953.3 | 5,189.8 | 5,437.6 | 5,697.3 | 5,969.3 |
| Revenue Growth, % | 0 | 23.8 | 33.95 | -3.45 | 6.41 | 4.77 | 4.77 | 4.77 | 4.77 | 4.77 |
| EBITDA | 258.2 | 394.8 | 574.6 | 566.9 | 589.1 | 579.6 | 607.3 | 636.3 | 666.7 | 698.5 |
| EBITDA, % | 9.31 | 11.49 | 12.49 | 12.76 | 12.46 | 11.7 | 11.7 | 11.7 | 11.7 | 11.7 |
| Depreciation | 73.2 | 92.9 | 111.5 | 114.2 | 136.6 | 131.0 | 137.3 | 143.8 | 150.7 | 157.9 |
| Depreciation, % | 2.64 | 2.7 | 2.42 | 2.57 | 2.89 | 2.64 | 2.64 | 2.64 | 2.64 | 2.64 |
| EBIT | 185.1 | 301.9 | 463.1 | 452.7 | 452.5 | 448.6 | 470.0 | 492.5 | 516.0 | 540.6 |
| EBIT, % | 6.67 | 8.79 | 10.07 | 10.19 | 9.57 | 9.06 | 9.06 | 9.06 | 9.06 | 9.06 |
| Total Cash | 169.0 | 177.9 | 222.0 | 394.5 | 522.8 | 356.9 | 374.0 | 391.8 | 410.5 | 430.1 |
| Total Cash, percent | .0 | .0 | .0 | .0 | .0 | .0 | .0 | .0 | .0 | .0 |
| Account Receivables | 448.8 | 593.7 | 669.6 | 686.8 | 754.5 | 786.8 | 824.4 | 863.8 | 905.0 | 948.2 |
| Account Receivables, % | 16.17 | 17.28 | 14.55 | 15.46 | 15.96 | 15.89 | 15.89 | 15.89 | 15.89 | 15.89 |
| Inventories | 371.2 | 526.3 | 622.1 | 581.5 | 722.1 | 699.2 | 732.6 | 767.6 | 804.2 | 842.6 |
| Inventories, % | 13.38 | 15.32 | 13.52 | 13.09 | 15.27 | 14.12 | 14.12 | 14.12 | 14.12 | 14.12 |
| Accounts Payable | 291.8 | 403.0 | 389.0 | 391.2 | 477.7 | 491.5 | 515.0 | 539.6 | 565.3 | 592.3 |
| Accounts Payable, % | 10.52 | 11.73 | 8.45 | 8.81 | 10.11 | 9.92 | 9.92 | 9.92 | 9.92 | 9.92 |
| Capital Expenditure | -22.3 | -18.7 | -21.3 | -37.5 | -26.5 | -31.8 | -33.4 | -35.0 | -36.6 | -38.4 |
| Capital Expenditure, % | -0.80453 | -0.54485 | -0.462 | -0.84348 | -0.55952 | -0.64288 | -0.64288 | -0.64288 | -0.64288 | -0.64288 |
| Tax Rate, % | 26.77 | 26.77 | 26.77 | 26.77 | 26.77 | 26.77 | 26.77 | 26.77 | 26.77 | 26.77 |
| EBITAT | 134.2 | 220.5 | 332.7 | 328.2 | 331.4 | 325.8 | 341.3 | 357.6 | 374.7 | 392.6 |
| Depreciation | ||||||||||
| Changes in Account Receivables | ||||||||||
| Changes in Inventories | ||||||||||
| Changes in Accounts Payable | ||||||||||
| Capital Expenditure | ||||||||||
| UFCF | -343.2 | 105.9 | 237.2 | 430.5 | 319.7 | 429.3 | 397.7 | 416.7 | 436.6 | 457.5 |
| WACC, % | 7.57 | 7.57 | 7.56 | 7.57 | 7.58 | 7.57 | 7.57 | 7.57 | 7.57 | 7.57 |
| PV UFCF | ||||||||||
| SUM PV UFCF | 1,721.4 | |||||||||
| Long Term Growth Rate, % | 2.00 | |||||||||
| Free cash flow (T + 1) | 467 | |||||||||
| Terminal Value | 8,378 | |||||||||
| Present Terminal Value | 5,817 | |||||||||
| Enterprise Value | 7,538 | |||||||||
| Net Debt | 1,203 | |||||||||
| Equity Value | 6,336 | |||||||||
| Diluted Shares Outstanding, MM | 57 | |||||||||
| Equity Value Per Share | 110.74 |
What You Will Receive
- Genuine IMCD Data: Preloaded financial metrics – covering everything from revenue to EBIT – utilizing actual and projected data.
- Comprehensive Customization: Modify all key parameters (yellow cells) such as WACC, growth rates, and tax percentages.
- Instant Valuation Adjustments: Automatic recalculations to assess the effects of changes on IMCD's fair value.
- User-Friendly Excel Template: Designed for quick edits, scenario analysis, and in-depth forecasting.
- Efficient and Precise: Avoid building models from the ground up while ensuring accuracy and adaptability.
Core Features
- Customizable Forecast Inputs: Adjust essential variables such as revenue growth, EBITDA margin, and capital expenditures.
- Instant DCF Valuation: Quickly computes intrinsic value, net present value (NPV), and additional outputs.
- High-Quality Accuracy: Leverages IMCD N.V.'s real financial data for precise valuation results.
- Simplified Scenario Analysis: Effortlessly test various assumptions and analyze different outcomes.
- Efficiency Booster: Avoid the complexities of building elaborate valuation models from the ground up.
How It Functions
- Step 1: Download the preconfigured Excel template featuring IMCD N.V. (IMCDAS) data.
- Step 2: Review the pre-filled worksheets to grasp the essential metrics.
- Step 3: Modify forecasts and assumptions in the editable yellow cells (WACC, growth, margins).
- Step 4: Immediately see updated results, including IMCD N.V.'s (IMCDAS) intrinsic value.
- Step 5: Use the outcomes to make informed investment choices or create detailed reports.
Why Choose the IMCD N.V. (IMCDAS) Calculator?
- Precision: Based on accurate IMCD financial data to ensure reliable results.
- Versatility: Tailored for users to easily test and adjust their inputs.
- Efficiency: Avoid the complexity of creating a DCF model from the ground up.
- Expert Quality: Crafted with the expertise and usability expected at the CFO level.
- User-Centric: Intuitive interface, suitable for users without extensive financial modeling skills.
Who Can Benefit from IMCD N.V. (IMCDAS)?
- Investors: Make informed choices with a reliable resource for market analysis.
- Market Analysts: Streamline your research with easy access to data and insights about IMCD N.V. (IMCDAS).
- Consultants: Efficiently tailor reports and presentations specific to client needs using our tools.
- Business Enthusiasts: Expand your knowledge of market trends and strategies with practical examples.
- Educators and Students: Leverage this resource as a hands-on tool for courses in business and finance.
What the Template Contains
- Operating and Balance Sheet Data: Pre-filled historical data and forecasts for IMCD N.V. (IMCDAS), including revenue, EBITDA, EBIT, and capital expenditures.
- WACC Calculation: A dedicated sheet for Weighted Average Cost of Capital (WACC), featuring parameters such as Beta, risk-free rate, and share price.
- DCF Valuation (Unlevered and Levered): Editable Discounted Cash Flow models that display intrinsic value with comprehensive calculations.
- Financial Statements: Pre-loaded annual and quarterly financial statements to facilitate analysis.
- Key Ratios: Includes profitability, leverage, and efficiency ratios specific to IMCD N.V. (IMCDAS).
- Dashboard and Charts: Visual summary of valuation outputs and assumptions for easier analysis of results.
Disclaimer
All information, articles, and product details provided on this website are for general informational and educational purposes only. We do not claim any ownership over, nor do we intend to infringe upon, any trademarks, copyrights, logos, brand names, or other intellectual property mentioned or depicted on this site. Such intellectual property remains the property of its respective owners, and any references here are made solely for identification or informational purposes, without implying any affiliation, endorsement, or partnership.
We make no representations or warranties, express or implied, regarding the accuracy, completeness, or suitability of any content or products presented. Nothing on this website should be construed as legal, tax, investment, financial, medical, or other professional advice. In addition, no part of this site—including articles or product references—constitutes a solicitation, recommendation, endorsement, advertisement, or offer to buy or sell any securities, franchises, or other financial instruments, particularly in jurisdictions where such activity would be unlawful.
All content is of a general nature and may not address the specific circumstances of any individual or entity. It is not a substitute for professional advice or services. Any actions you take based on the information provided here are strictly at your own risk. You accept full responsibility for any decisions or outcomes arising from your use of this website and agree to release us from any liability in connection with your use of, or reliance upon, the content or products found herein.