
|
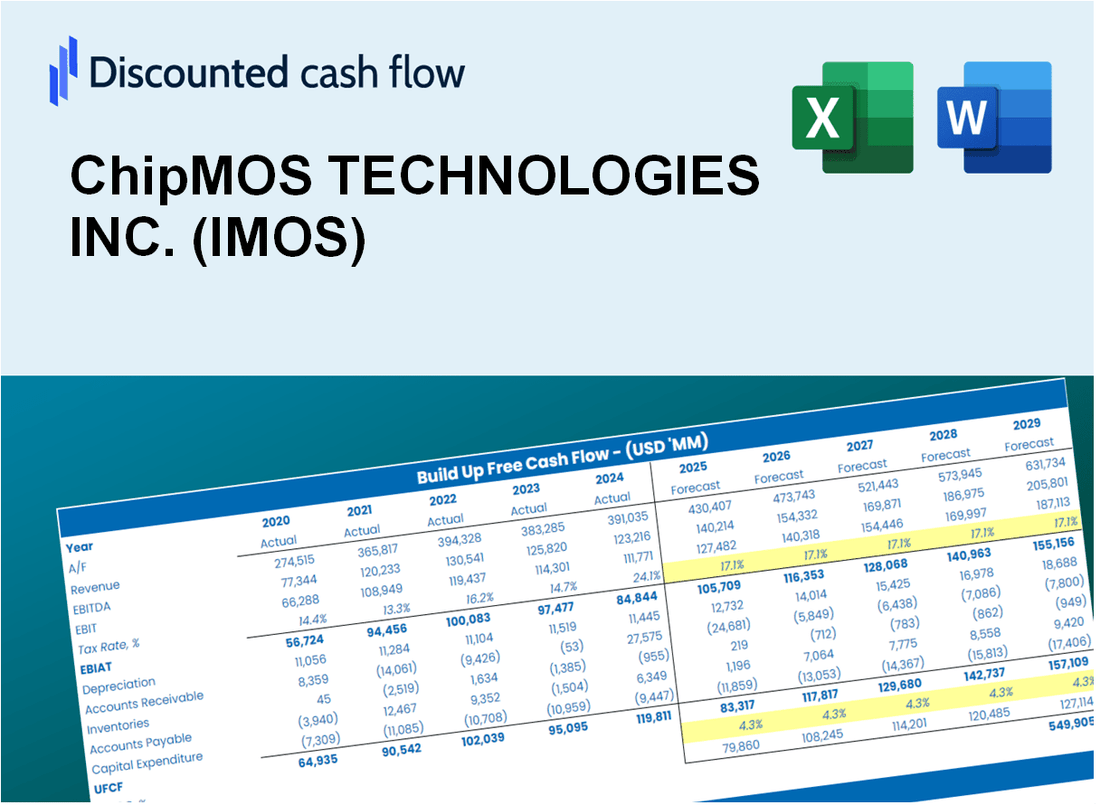
Chipmos Technologies INC. (IMOS) Évaluation DCF |
Entièrement Modifiable: Adapté À Vos Besoins Dans Excel Ou Sheets
Conception Professionnelle: Modèles Fiables Et Conformes Aux Normes Du Secteur
Pré-Construits Pour Une Utilisation Rapide Et Efficace
Compatible MAC/PC, entièrement débloqué
Aucune Expertise N'Est Requise; Facile À Suivre
ChipMOS TECHNOLOGIES INC. (IMOS) Bundle
Évaluez les perspectives financières de Chipmos Technologies Inc. avec une expertise! Cette calculatrice (IMOS) DCF fournit des données financières pré-remplies ainsi qu'une flexibilité complète pour modifier la croissance des revenus, le WACC, les marges et d'autres hypothèses cruciales pour s'aligner sur vos projections.
What You Will Receive
- Pre-Filled Financial Model: ChipMOS TECHNOLOGIES INC.'s actual data enables accurate DCF valuation.
- Comprehensive Forecast Control: Modify revenue growth, margins, WACC, and other critical factors.
- Instantaneous Calculations: Automatic updates ensure you see results as you adjust variables.
- Professional-Grade Template: A polished Excel file crafted for high-quality valuation.
- Customizable and Reusable: Designed for adaptability, allowing repeated use for in-depth forecasts.
Key Features
- Customizable Financial Inputs: Adjust essential metrics such as revenue growth, EBITDA %, and capital expenditures for ChipMOS TECHNOLOGIES INC. (IMOS).
- Instant DCF Valuation: Automatically computes intrinsic value, NPV, and additional financial metrics in real-time.
- High-Precision Accuracy: Leverages ChipMOS’s actual financial data to deliver realistic valuation results.
- Streamlined Scenario Analysis: Effortlessly evaluate various assumptions and analyze different outcomes.
- Efficiency Booster: Reduce the need to construct intricate valuation models from the ground up.
How It Works
- Download: Obtain the pre-configured Excel file containing ChipMOS TECHNOLOGIES INC.'s (IMOS) financial data.
- Customize: Modify projections, including revenue growth, EBITDA %, and WACC.
- Update Automatically: The intrinsic value and NPV calculations refresh in real-time.
- Test Scenarios: Develop various projections and instantly compare the results.
- Make Decisions: Utilize the valuation findings to inform your investment approach.
Why Choose ChipMOS TECHNOLOGIES INC. (IMOS)?
- Industry Expertise: Benefit from years of experience in semiconductor testing and assembly.
- Innovative Solutions: Cutting-edge technology ensures high-quality services and products.
- Customizable Services: Tailor our offerings to meet your specific needs and requirements.
- Transparent Communication: Clear reporting and updates keep you informed throughout the process.
- Trusted by Clients: Our commitment to excellence has earned us a reputation among industry leaders.
Who Should Use This Product?
- Professional Investors: Develop comprehensive and accurate valuation models for analyzing ChipMOS TECHNOLOGIES INC. (IMOS) investments.
- Corporate Finance Teams: Evaluate valuation scenarios to inform strategic decisions within the organization.
- Consultants and Advisors: Deliver precise valuation insights to clients considering investments in ChipMOS TECHNOLOGIES INC. (IMOS).
- Students and Educators: Utilize real-world data to enhance learning and practice in financial modeling related to the semiconductor industry.
- Tech Enthusiasts: Gain insights into how semiconductor companies like ChipMOS TECHNOLOGIES INC. (IMOS) are valued in the financial markets.
What the Template Contains
- Historical Data: Includes ChipMOS TECHNOLOGIES INC.'s (IMOS) past financials and baseline forecasts.
- DCF and Levered DCF Models: Detailed templates to calculate ChipMOS TECHNOLOGIES INC.'s (IMOS) intrinsic value.
- WACC Sheet: Pre-built calculations for Weighted Average Cost of Capital.
- Editable Inputs: Modify key drivers like growth rates, EBITDA %, and CAPEX assumptions.
- Quarterly and Annual Statements: A complete breakdown of ChipMOS TECHNOLOGIES INC.'s (IMOS) financials.
- Interactive Dashboard: Visualize valuation results and projections dynamically.
Disclaimer
All information, articles, and product details provided on this website are for general informational and educational purposes only. We do not claim any ownership over, nor do we intend to infringe upon, any trademarks, copyrights, logos, brand names, or other intellectual property mentioned or depicted on this site. Such intellectual property remains the property of its respective owners, and any references here are made solely for identification or informational purposes, without implying any affiliation, endorsement, or partnership.
We make no representations or warranties, express or implied, regarding the accuracy, completeness, or suitability of any content or products presented. Nothing on this website should be construed as legal, tax, investment, financial, medical, or other professional advice. In addition, no part of this site—including articles or product references—constitutes a solicitation, recommendation, endorsement, advertisement, or offer to buy or sell any securities, franchises, or other financial instruments, particularly in jurisdictions where such activity would be unlawful.
All content is of a general nature and may not address the specific circumstances of any individual or entity. It is not a substitute for professional advice or services. Any actions you take based on the information provided here are strictly at your own risk. You accept full responsibility for any decisions or outcomes arising from your use of this website and agree to release us from any liability in connection with your use of, or reliance upon, the content or products found herein.