
|
Inchcape plc (Inch.L) Valation DCF |
Entièrement Modifiable: Adapté À Vos Besoins Dans Excel Ou Sheets
Conception Professionnelle: Modèles Fiables Et Conformes Aux Normes Du Secteur
Pré-Construits Pour Une Utilisation Rapide Et Efficace
Compatible MAC/PC, entièrement débloqué
Aucune Expertise N'Est Requise; Facile À Suivre
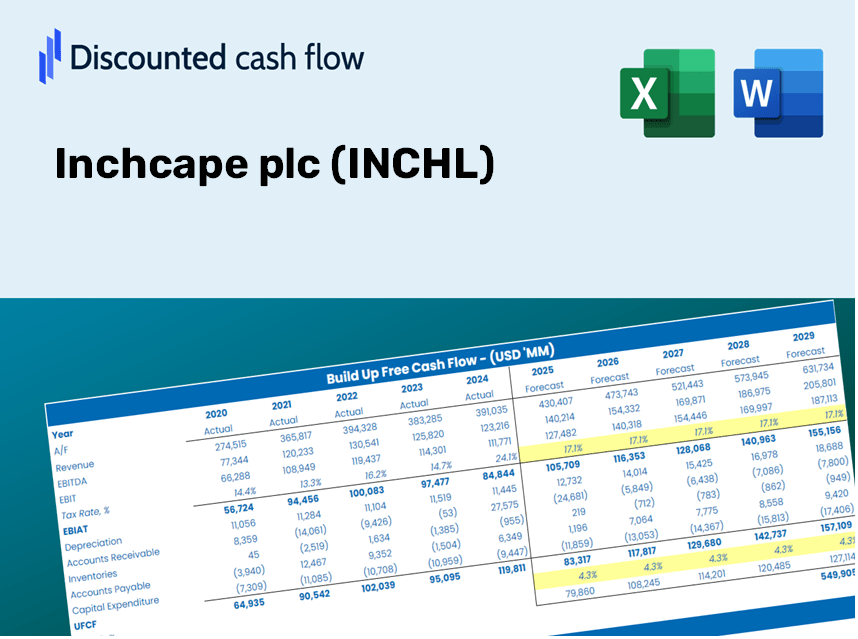
Inchcape plc (INCH.L) Bundle
Simplifier Inchcape PLC (Inchl) Valation avec cette calculatrice DCF personnalisable! Doté de Real Inchcape Plc (InCHL) Financials and Adjustable Prévision des entrées, vous pouvez tester les scénarios et découvrir la juste valeur de InChcape Plc (Inchl) en minutes.
Discounted Cash Flow (DCF) - (USD MM)
| Year | AY1 2020 |
AY2 2021 |
AY3 2022 |
AY4 2023 |
AY5 2024 |
FY1 2025 |
FY2 2026 |
FY3 2027 |
FY4 2028 |
FY5 2029 |
|---|---|---|---|---|---|---|---|---|---|---|
| Revenue | 6,837.8 | 6,900.9 | 8,132.7 | 11,447.0 | 9,263.0 | 10,199.6 | 11,231.0 | 12,366.6 | 13,617.1 | 14,993.9 |
| Revenue Growth, % | 0 | 0.92281 | 17.85 | 40.75 | -19.08 | 10.11 | 10.11 | 10.11 | 10.11 | 10.11 |
| EBITDA | 11.7 | 287.4 | 492.1 | 814.0 | 740.0 | 519.9 | 572.5 | 630.4 | 694.1 | 764.3 |
| EBITDA, % | 0.17111 | 4.16 | 6.05 | 7.11 | 7.99 | 5.1 | 5.1 | 5.1 | 5.1 | 5.1 |
| Depreciation | 108.8 | 109.0 | 118.6 | 162.0 | 129.0 | 151.7 | 167.0 | 183.9 | 202.5 | 223.0 |
| Depreciation, % | 1.59 | 1.58 | 1.46 | 1.42 | 1.39 | 1.49 | 1.49 | 1.49 | 1.49 | 1.49 |
| EBIT | -97.1 | 178.4 | 373.5 | 652.0 | 611.0 | 368.2 | 405.4 | 446.4 | 491.6 | 541.3 |
| EBIT, % | -1.42 | 2.59 | 4.59 | 5.7 | 6.6 | 3.61 | 3.61 | 3.61 | 3.61 | 3.61 |
| Total Cash | 481.4 | 596.6 | 1,064.4 | 689.0 | 549.0 | 830.6 | 914.6 | 1,007.1 | 1,109.0 | 1,221.1 |
| Total Cash, percent | .0 | .0 | .0 | .0 | .0 | .0 | .0 | .0 | .0 | .0 |
| Account Receivables | 315.2 | 184.8 | 428.0 | 743.0 | 829.0 | 571.0 | 628.7 | 692.3 | 762.3 | 839.4 |
| Account Receivables, % | 4.61 | 2.68 | 5.26 | 6.49 | 8.95 | 5.6 | 5.6 | 5.6 | 5.6 | 5.6 |
| Inventories | 1,216.2 | 1,134.7 | 2,375.8 | 2,718.0 | 1,935.0 | 2,204.7 | 2,427.6 | 2,673.1 | 2,943.4 | 3,241.0 |
| Inventories, % | 17.79 | 16.44 | 29.21 | 23.74 | 20.89 | 21.62 | 21.62 | 21.62 | 21.62 | 21.62 |
| Accounts Payable | 1,161.6 | 1,017.6 | 418.0 | 358.0 | 2,565.0 | 1,380.9 | 1,520.5 | 1,674.2 | 1,843.5 | 2,029.9 |
| Accounts Payable, % | 16.99 | 14.75 | 5.14 | 3.13 | 27.69 | 13.54 | 13.54 | 13.54 | 13.54 | 13.54 |
| Capital Expenditure | -41.9 | -64.6 | -68.5 | -93.0 | -79.0 | -82.7 | -91.1 | -100.3 | -110.5 | -121.6 |
| Capital Expenditure, % | -0.61277 | -0.93611 | -0.84228 | -0.81244 | -0.85286 | -0.81129 | -0.81129 | -0.81129 | -0.81129 | -0.81129 |
| Tax Rate, % | -1.69 | -1.69 | -1.69 | -1.69 | -1.69 | -1.69 | -1.69 | -1.69 | -1.69 | -1.69 |
| EBITAT | -106.4 | 140.3 | 274.6 | 426.2 | 621.3 | 307.5 | 338.5 | 372.8 | 410.5 | 452.0 |
| Depreciation | ||||||||||
| Changes in Account Receivables | ||||||||||
| Changes in Inventories | ||||||||||
| Changes in Accounts Payable | ||||||||||
| Capital Expenditure | ||||||||||
| UFCF | -409.3 | 252.6 | -1,759.2 | -222.0 | 3,575.3 | -819.4 | 273.4 | 301.1 | 331.5 | 365.1 |
| WACC, % | 9.75 | 8.95 | 8.76 | 8.45 | 9.75 | 9.13 | 9.13 | 9.13 | 9.13 | 9.13 |
| PV UFCF | ||||||||||
| SUM PV UFCF | 180.1 | |||||||||
| Long Term Growth Rate, % | 2.00 | |||||||||
| Free cash flow (T + 1) | 372 | |||||||||
| Terminal Value | 5,223 | |||||||||
| Present Terminal Value | 3,375 | |||||||||
| Enterprise Value | 3,555 | |||||||||
| Net Debt | 492 | |||||||||
| Equity Value | 3,063 | |||||||||
| Diluted Shares Outstanding, MM | 413 | |||||||||
| Equity Value Per Share | 741.38 |
Benefits of Choosing Inchcape plc (INCHL)
- Comprehensive Financial Model: Utilize Inchcape’s actual data for accurate DCF valuation.
- Complete Forecasting Control: Modify revenue growth, profit margins, WACC, and other essential factors.
- Real-Time Calculations: Automatic updates provide instant results as you make adjustments.
- Professional-Grade Template: A polished Excel file specifically designed for investor-ready valuations.
- Flexible and Reusable: Customizable for versatile use, perfect for in-depth forecasts.
Key Features
- 🔍 Real-Life INCHL Financials: Pre-filled historical and projected data for Inchcape plc.
- ✏️ Fully Customizable Inputs: Adjust all critical parameters (yellow cells) such as WACC, growth %, and tax rates.
- 📊 Professional DCF Valuation: Integrated formulas to calculate Inchcape’s intrinsic value using the Discounted Cash Flow method.
- ⚡ Instant Results: Visualize Inchcape’s valuation immediately after making adjustments.
- Scenario Analysis: Evaluate and compare outcomes for various financial assumptions side-by-side.
How It Works
- Step 1: Download the Excel file.
- Step 2: Review Inchcape plc’s pre-filled financial data and forecasts.
- Step 3: Modify key inputs such as revenue growth, WACC, and tax rates (highlighted cells).
- Step 4: Observe the DCF model update in real-time as you adjust the assumptions.
- Step 5: Analyze the outputs and utilize the findings for your investment strategies.
Why Choose This Calculator for Inchcape plc (INCHL)?
- Reliable Data: Authentic Inchcape financials guarantee trustworthy valuation outcomes.
- Flexible Options: Modify essential variables such as growth rates, WACC, and tax rates to align with your forecasts.
- Efficiency Boost: Ready-made calculations save you time by eliminating the need to build from the ground up.
- Industry-Standard Tool: Tailored for investors, analysts, and consultants alike.
- Easy to Use: User-friendly design and clear, step-by-step guidance make it accessible for everyone.
Who Can Benefit from Inchcape plc (INCHL)?
- Investors: Empower yourself to make informed investment choices with our advanced valuation tools.
- Financial Analysts: Enhance efficiency with a customizable DCF model that’s ready to use.
- Consultants: Seamlessly modify templates for impactful client presentations and reports.
- Finance Enthusiasts: Broaden your knowledge of valuation methodologies through practical, real-world examples.
- Educators and Students: Utilize our resources as an effective teaching aid for finance courses.
Contents of the Template
- Pre-Filled DCF Model: Inchcape plc's financial data preloaded for immediate application.
- WACC Calculator: Comprehensive calculations for the Weighted Average Cost of Capital.
- Financial Ratios: Assess Inchcape plc's profitability, leverage, and operational efficiency.
- Editable Inputs: Modify assumptions such as growth rates, margins, and CAPEX to tailor your analysis.
- Financial Statements: Access to annual and quarterly reports for in-depth analysis.
- Interactive Dashboard: Effortlessly visualize essential valuation metrics and outcomes.
Disclaimer
All information, articles, and product details provided on this website are for general informational and educational purposes only. We do not claim any ownership over, nor do we intend to infringe upon, any trademarks, copyrights, logos, brand names, or other intellectual property mentioned or depicted on this site. Such intellectual property remains the property of its respective owners, and any references here are made solely for identification or informational purposes, without implying any affiliation, endorsement, or partnership.
We make no representations or warranties, express or implied, regarding the accuracy, completeness, or suitability of any content or products presented. Nothing on this website should be construed as legal, tax, investment, financial, medical, or other professional advice. In addition, no part of this site—including articles or product references—constitutes a solicitation, recommendation, endorsement, advertisement, or offer to buy or sell any securities, franchises, or other financial instruments, particularly in jurisdictions where such activity would be unlawful.
All content is of a general nature and may not address the specific circumstances of any individual or entity. It is not a substitute for professional advice or services. Any actions you take based on the information provided here are strictly at your own risk. You accept full responsibility for any decisions or outcomes arising from your use of this website and agree to release us from any liability in connection with your use of, or reliance upon, the content or products found herein.