
|
Incyte Corporation (Incy) Valation DCF |
Entièrement Modifiable: Adapté À Vos Besoins Dans Excel Ou Sheets
Conception Professionnelle: Modèles Fiables Et Conformes Aux Normes Du Secteur
Pré-Construits Pour Une Utilisation Rapide Et Efficace
Compatible MAC/PC, entièrement débloqué
Aucune Expertise N'Est Requise; Facile À Suivre
Incyte Corporation (INCY) Bundle
Améliorez vos stratégies d'investissement avec la calculatrice DCF Incyte Corporation (Incy)! Utilisez des données financières authentiques Incyte, ajustez les projections et les dépenses de croissance et observez comment ces modifications affectent la valeur intrinsèque d'Incyte Corporation (Incy) en temps réel.
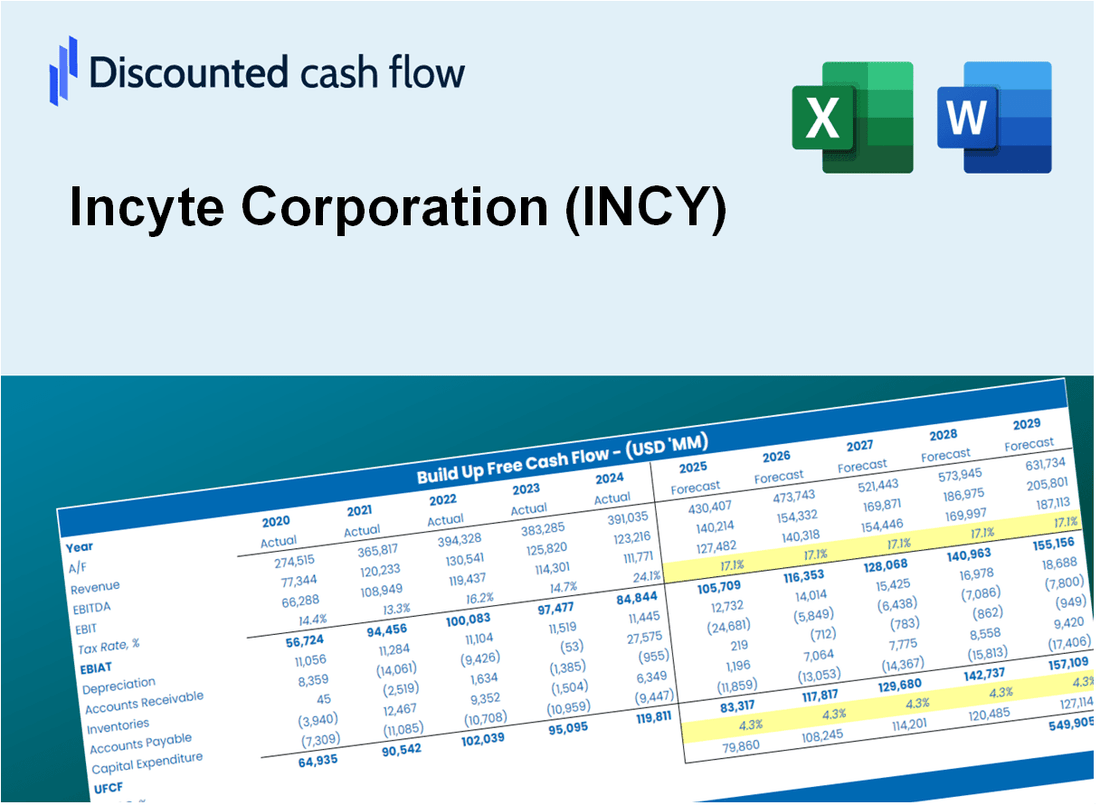
Discounted Cash Flow (DCF) - (USD MM)
| Year | AY1 2020 |
AY2 2021 |
AY3 2022 |
AY4 2023 |
AY5 2024 |
FY1 2025 |
FY2 2026 |
FY3 2027 |
FY4 2028 |
FY5 2029 |
|---|---|---|---|---|---|---|---|---|---|---|
| Revenue | 2,666.7 | 2,986.3 | 3,394.6 | 3,695.6 | 4,241.2 | 4,763.8 | 5,350.8 | 6,010.2 | 6,750.7 | 7,582.6 |
| Revenue Growth, % | 0 | 11.98 | 13.67 | 8.87 | 14.76 | 12.32 | 12.32 | 12.32 | 12.32 | 12.32 |
| EBITDA | -178.2 | 630.2 | 599.6 | 919.4 | 408.2 | 634.4 | 712.6 | 800.4 | 899.0 | 1,009.8 |
| EBITDA, % | -6.68 | 21.1 | 17.66 | 24.88 | 9.62 | 13.32 | 13.32 | 13.32 | 13.32 | 13.32 |
| Depreciation | 51.8 | 57.8 | 67.9 | 82.7 | 89.2 | 97.4 | 109.4 | 122.8 | 138.0 | 155.0 |
| Depreciation, % | 1.94 | 1.94 | 2 | 2.24 | 2.1 | 2.04 | 2.04 | 2.04 | 2.04 | 2.04 |
| EBIT | -230.0 | 572.4 | 531.8 | 836.8 | 318.9 | 537.0 | 603.2 | 677.5 | 761.0 | 854.8 |
| EBIT, % | -8.63 | 19.17 | 15.67 | 22.64 | 7.52 | 11.27 | 11.27 | 11.27 | 11.27 | 11.27 |
| Total Cash | 1,801.4 | 2,348.2 | 3,239.0 | 3,656.0 | 2,158.1 | 3,729.2 | 4,188.7 | 4,704.9 | 5,284.6 | 5,935.8 |
| Total Cash, percent | .0 | .0 | .0 | .0 | .0 | .0 | .0 | .0 | .0 | .0 |
| Account Receivables | 482.0 | 616.3 | 644.9 | 743.6 | 853.2 | 933.2 | 1,048.2 | 1,177.3 | 1,322.4 | 1,485.3 |
| Account Receivables, % | 18.07 | 20.64 | 19 | 20.12 | 20.12 | 19.59 | 19.59 | 19.59 | 19.59 | 19.59 |
| Inventories | 16.4 | 27.9 | 42.0 | 63.0 | 58.9 | 56.0 | 62.9 | 70.7 | 79.4 | 89.2 |
| Inventories, % | 0.61593 | 0.93441 | 1.24 | 1.7 | 1.39 | 1.18 | 1.18 | 1.18 | 1.18 | 1.18 |
| Accounts Payable | 98.8 | 172.1 | 277.5 | 109.6 | 197.5 | 240.7 | 270.4 | 303.7 | 341.1 | 383.1 |
| Accounts Payable, % | 3.7 | 5.76 | 8.18 | 2.97 | 4.66 | 5.05 | 5.05 | 5.05 | 5.05 | 5.05 |
| Capital Expenditure | -187.4 | -181.0 | -77.8 | -47.5 | -86.3 | -178.2 | -200.1 | -224.8 | -252.5 | -283.6 |
| Capital Expenditure, % | -7.03 | -6.06 | -2.29 | -1.28 | -2.03 | -3.74 | -3.74 | -3.74 | -3.74 | -3.74 |
| Tax Rate, % | 89.7 | 89.7 | 89.7 | 89.7 | 89.7 | 89.7 | 89.7 | 89.7 | 89.7 | 89.7 |
| EBITAT | -292.9 | 951.8 | 342.4 | 599.4 | 32.8 | 372.0 | 417.8 | 469.3 | 527.1 | 592.1 |
| Depreciation | ||||||||||
| Changes in Account Receivables | ||||||||||
| Changes in Inventories | ||||||||||
| Changes in Accounts Payable | ||||||||||
| Capital Expenditure | ||||||||||
| UFCF | -828.2 | 756.1 | 395.2 | 347.0 | 18.2 | 257.3 | 234.8 | 263.8 | 296.3 | 332.8 |
| WACC, % | 7.63 | 7.63 | 7.63 | 7.63 | 7.62 | 7.63 | 7.63 | 7.63 | 7.63 | 7.63 |
| PV UFCF | ||||||||||
| SUM PV UFCF | 1,104.4 | |||||||||
| Long Term Growth Rate, % | 4.00 | |||||||||
| Free cash flow (T + 1) | 346 | |||||||||
| Terminal Value | 9,532 | |||||||||
| Present Terminal Value | 6,599 | |||||||||
| Enterprise Value | 7,704 | |||||||||
| Net Debt | -1,644 | |||||||||
| Equity Value | 9,348 | |||||||||
| Diluted Shares Outstanding, MM | 211 | |||||||||
| Equity Value Per Share | 44.40 |
What You Will Get
- Editable Forecast Inputs: Easily modify assumptions (growth %, margins, WACC) to explore various scenarios.
- Real-World Data: Incyte Corporation’s (INCY) financial data pre-filled to kickstart your analysis.
- Automatic DCF Outputs: The template computes Net Present Value (NPV) and intrinsic value for you.
- Customizable and Professional: A sleek Excel model that adjusts to your valuation requirements.
- Built for Analysts and Investors: Perfect for evaluating projections, confirming strategies, and optimizing your time.
Key Features
- Comprehensive DCF Calculator: Features detailed unlevered and levered DCF valuation models tailored for Incyte Corporation (INCY).
- WACC Calculator: Pre-built Weighted Average Cost of Capital sheet with adjustable inputs specific to Incyte Corporation (INCY).
- Customizable Forecast Assumptions: Easily modify growth rates, capital expenditures, and discount rates for Incyte Corporation (INCY).
- Integrated Financial Ratios: Evaluate profitability, leverage, and efficiency ratios relevant to Incyte Corporation (INCY).
- Visual Dashboard and Charts: Graphical outputs that summarize key valuation metrics for straightforward analysis of Incyte Corporation (INCY).
How It Works
- Step 1: Download the Excel file.
- Step 2: Review pre-entered Incyte Corporation (INCY) data (historical and projected).
- Step 3: Adjust key assumptions (yellow cells) based on your analysis.
- Step 4: View automatic recalculations for Incyte Corporation’s intrinsic value.
- Step 5: Use the outputs for investment decisions or reporting.
Why Choose This Calculator for Incyte Corporation (INCY)?
- Designed for Experts: A sophisticated tool utilized by financial analysts, investors, and industry consultants.
- Accurate Data: Incyte’s historical and projected financials integrated for precise calculations.
- Flexible Scenario Analysis: Effortlessly test various forecasts and assumptions.
- Comprehensive Outputs: Automatically computes intrinsic value, NPV, and essential financial metrics.
- User-Friendly: Detailed step-by-step guidance to navigate the calculator.
Who Should Use Incyte Corporation (INCY)?
- Biotech Investors: Make informed decisions with access to comprehensive research and analytics.
- Healthcare Analysts: Streamline your analysis with ready-to-use financial models tailored for biotech.
- Consultants: Efficiently customize presentations or reports for clients in the pharmaceutical sector.
- Life Sciences Enthusiasts: Enhance your knowledge of biotech investments through detailed case studies.
- Students and Educators: Utilize it as a practical resource in courses focused on biotechnology and finance.
What the Template Contains
- Operating and Balance Sheet Data: Pre-filled Incyte Corporation (INCY) historical data and forecasts, including revenue, EBITDA, EBIT, and capital expenditures.
- WACC Calculation: A dedicated sheet for Weighted Average Cost of Capital (WACC), including parameters like Beta, risk-free rate, and share price.
- DCF Valuation (Unlevered and Levered): Editable Discounted Cash Flow models showing intrinsic value with detailed calculations.
- Financial Statements: Pre-loaded financial statements (annual and quarterly) to support analysis.
- Key Ratios: Includes profitability, leverage, and efficiency ratios for Incyte Corporation (INCY).
- Dashboard and Charts: Visual summary of valuation outputs and assumptions to analyze results easily.
Disclaimer
All information, articles, and product details provided on this website are for general informational and educational purposes only. We do not claim any ownership over, nor do we intend to infringe upon, any trademarks, copyrights, logos, brand names, or other intellectual property mentioned or depicted on this site. Such intellectual property remains the property of its respective owners, and any references here are made solely for identification or informational purposes, without implying any affiliation, endorsement, or partnership.
We make no representations or warranties, express or implied, regarding the accuracy, completeness, or suitability of any content or products presented. Nothing on this website should be construed as legal, tax, investment, financial, medical, or other professional advice. In addition, no part of this site—including articles or product references—constitutes a solicitation, recommendation, endorsement, advertisement, or offer to buy or sell any securities, franchises, or other financial instruments, particularly in jurisdictions where such activity would be unlawful.
All content is of a general nature and may not address the specific circumstances of any individual or entity. It is not a substitute for professional advice or services. Any actions you take based on the information provided here are strictly at your own risk. You accept full responsibility for any decisions or outcomes arising from your use of this website and agree to release us from any liability in connection with your use of, or reliance upon, the content or products found herein.