
|
Indie Semiconductor, Inc. (INDI) Évaluation DCF |
Entièrement Modifiable: Adapté À Vos Besoins Dans Excel Ou Sheets
Conception Professionnelle: Modèles Fiables Et Conformes Aux Normes Du Secteur
Pré-Construits Pour Une Utilisation Rapide Et Efficace
Compatible MAC/PC, entièrement débloqué
Aucune Expertise N'Est Requise; Facile À Suivre
indie Semiconductor, Inc. (INDI) Bundle
Que vous soyez un investisseur ou un analyste, ce (indice de calculant DCF est votre outil incontournable pour une évaluation précise. Préchargé avec des données réelles d'Indie Semiconductor, Inc., vous pouvez ajuster les prévisions et observer les effets en temps réel.
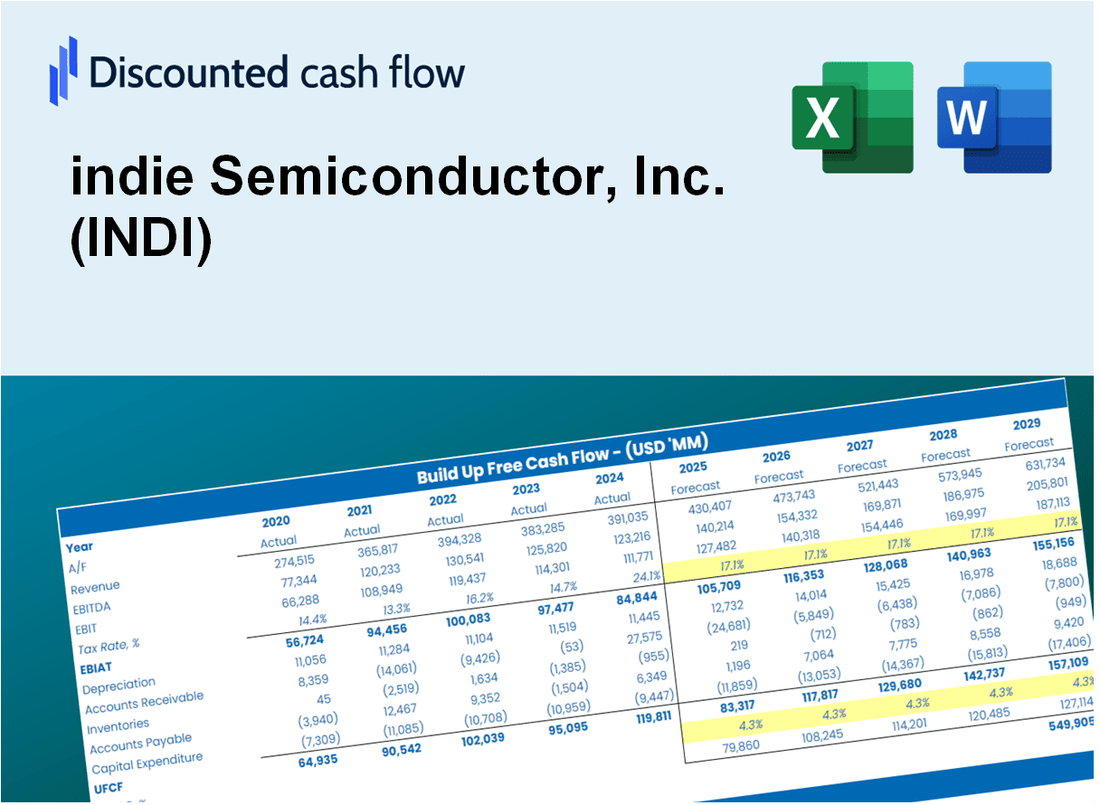
Discounted Cash Flow (DCF) - (USD MM)
| Year | AY1 2020 |
AY2 2021 |
AY3 2022 |
AY4 2023 |
AY5 2024 |
FY1 2025 |
FY2 2026 |
FY3 2027 |
FY4 2028 |
FY5 2029 |
|---|---|---|---|---|---|---|---|---|---|---|
| Revenue | 22.6 | 48.4 | 110.8 | 223.2 | 216.7 | 377.6 | 658.1 | 1,146.9 | 1,998.7 | 3,483.2 |
| Revenue Growth, % | 0 | 114.12 | 128.86 | 101.42 | -2.91 | 74.27 | 74.27 | 74.27 | 74.27 | 74.27 |
| EBITDA | -93.5 | -111.7 | -35.7 | -89.9 | -93.9 | -238.5 | -415.7 | -724.5 | -1,262.6 | -2,200.3 |
| EBITDA, % | -413.49 | -230.79 | -32.19 | -40.3 | -43.35 | -63.17 | -63.17 | -63.17 | -63.17 | -63.17 |
| Depreciation | 2.7 | 6.0 | 16.8 | 31.8 | 43.1 | 55.4 | 96.5 | 168.2 | 293.1 | 510.8 |
| Depreciation, % | 11.73 | 12.33 | 15.13 | 14.27 | 19.87 | 14.67 | 14.67 | 14.67 | 14.67 | 14.67 |
| EBIT | -96.1 | -117.7 | -52.4 | -121.8 | -137.0 | -275.8 | -480.6 | -837.5 | -1,459.5 | -2,543.6 |
| EBIT, % | -425.22 | -243.11 | -47.32 | -54.57 | -63.22 | -73.02 | -73.02 | -73.02 | -73.02 | -73.02 |
| Total Cash | 18.7 | 219.1 | 321.6 | 151.7 | 274.2 | 340.4 | 593.2 | 1,033.7 | 1,801.5 | 3,139.5 |
| Total Cash, percent | .0 | .0 | .0 | .0 | .0 | .0 | .0 | .0 | .0 | .0 |
| Account Receivables | 6.0 | 13.8 | 26.4 | 72.1 | 52.0 | 102.1 | 177.9 | 310.0 | 540.3 | 941.6 |
| Account Receivables, % | 26.4 | 28.59 | 23.86 | 32.31 | 24 | 27.03 | 27.03 | 27.03 | 27.03 | 27.03 |
| Inventories | 2.9 | 9.1 | 13.3 | 33.1 | 49.9 | 61.5 | 107.2 | 186.8 | 325.5 | 567.2 |
| Inventories, % | 12.83 | 18.76 | 11.96 | 14.85 | 23.02 | 16.28 | 16.28 | 16.28 | 16.28 | 16.28 |
| Accounts Payable | 4.6 | 5.4 | 14.2 | 18.4 | 28.3 | 49.5 | 86.2 | 150.2 | 261.8 | 456.3 |
| Accounts Payable, % | 20.14 | 11.24 | 12.8 | 8.25 | 13.07 | 13.1 | 13.1 | 13.1 | 13.1 | 13.1 |
| Capital Expenditure | -.8 | -4.1 | -7.6 | -12.8 | -14.3 | -23.4 | -40.8 | -71.1 | -123.8 | -215.8 |
| Capital Expenditure, % | -3.41 | -8.41 | -6.83 | -5.71 | -6.62 | -6.2 | -6.2 | -6.2 | -6.2 | -6.2 |
| Tax Rate, % | 9.24 | 9.24 | 9.24 | 9.24 | 9.24 | 9.24 | 9.24 | 9.24 | 9.24 | 9.24 |
| EBITAT | -95.3 | -87.1 | -42.3 | -107.4 | -124.3 | -238.7 | -415.9 | -724.9 | -1,263.3 | -2,201.5 |
| Depreciation | ||||||||||
| Changes in Account Receivables | ||||||||||
| Changes in Inventories | ||||||||||
| Changes in Accounts Payable | ||||||||||
| Capital Expenditure | ||||||||||
| UFCF | -97.8 | -98.4 | -41.1 | -149.6 | -82.3 | -247.2 | -444.9 | -775.4 | -1,351.4 | -2,355.1 |
| WACC, % | 11.32 | 10.97 | 11.07 | 11.17 | 11.21 | 11.15 | 11.15 | 11.15 | 11.15 | 11.15 |
| PV UFCF | ||||||||||
| SUM PV UFCF | -3,421.2 | |||||||||
| Long Term Growth Rate, % | 2.00 | |||||||||
| Free cash flow (T + 1) | -2,402 | |||||||||
| Terminal Value | -26,260 | |||||||||
| Present Terminal Value | -15,481 | |||||||||
| Enterprise Value | -18,902 | |||||||||
| Net Debt | 124 | |||||||||
| Equity Value | -19,026 | |||||||||
| Diluted Shares Outstanding, MM | 175 | |||||||||
| Equity Value Per Share | -108.70 |
What You Will Get
- Real INDI Financial Data: Pre-filled with indie Semiconductor’s historical and projected data for precise analysis.
- Fully Editable Template: Modify key inputs like revenue growth, WACC, and EBITDA % with ease.
- Automatic Calculations: See indie Semiconductor’s intrinsic value update instantly based on your changes.
- Professional Valuation Tool: Designed for investors, analysts, and consultants seeking accurate DCF results.
- User-Friendly Design: Simple structure and clear instructions for all experience levels.
Key Features
- Pre-Loaded Data: indie Semiconductor, Inc.'s (INDI) historical financial statements and pre-filled forecasts.
- Fully Adjustable Inputs: Modify WACC, tax rates, revenue growth, and EBITDA margins.
- Instant Results: View indie Semiconductor, Inc.'s (INDI) intrinsic value recalculated in real time.
- Clear Visual Outputs: Dashboard charts illustrate valuation results and key metrics.
- Built for Accuracy: A professional tool designed for analysts, investors, and finance experts.
How It Works
- Download: Obtain the pre-configured Excel file containing indie Semiconductor, Inc.'s (INDI) financial data.
- Customize: Modify projections, including revenue growth, EBITDA %, and WACC as needed.
- Update Automatically: The intrinsic value and NPV calculations refresh in real-time.
- Test Scenarios: Generate various forecasts and analyze results instantly.
- Make Decisions: Leverage the valuation outcomes to inform your investment strategy.
Why Choose This Calculator for indie Semiconductor, Inc. (INDI)?
- All-in-One Solution: Combines DCF, WACC, and financial ratio analyses tailored for indie Semiconductor, Inc. (INDI).
- Flexible Parameters: Modify the yellow-highlighted cells to explore different financial scenarios.
- In-Depth Analysis: Automatically computes indie Semiconductor, Inc. (INDI)’s intrinsic value and Net Present Value.
- Preloaded Information: Historical and projected data provide reliable starting points for your analysis.
- Expert-Level Tool: Perfect for financial analysts, investors, and business consultants focusing on indie Semiconductor, Inc. (INDI).
Who Should Use This Product?
- Investors: Accurately estimate indie Semiconductor, Inc.'s (INDI) fair value before making investment decisions.
- CFOs: Leverage a professional-grade DCF model for financial reporting and analysis specific to indie Semiconductor, Inc. (INDI).
- Consultants: Quickly adapt the template for valuation reports tailored to indie Semiconductor, Inc. (INDI) clients.
- Entrepreneurs: Gain insights into financial modeling techniques utilized by leading tech companies, including indie Semiconductor, Inc. (INDI).
- Educators: Use it as a teaching tool to demonstrate valuation methodologies relevant to indie Semiconductor, Inc. (INDI).
What the Template Contains
- Operating and Balance Sheet Data: Pre-filled indie Semiconductor, Inc. (INDI) historical data and forecasts, including revenue, EBITDA, EBIT, and capital expenditures.
- WACC Calculation: A dedicated sheet for Weighted Average Cost of Capital (WACC), including parameters like Beta, risk-free rate, and share price.
- DCF Valuation (Unlevered and Levered): Editable Discounted Cash Flow models showing intrinsic value with detailed calculations.
- Financial Statements: Pre-loaded financial statements (annual and quarterly) to support analysis.
- Key Ratios: Includes profitability, leverage, and efficiency ratios for indie Semiconductor, Inc. (INDI).
- Dashboard and Charts: Visual summary of valuation outputs and assumptions to analyze results easily.
Disclaimer
All information, articles, and product details provided on this website are for general informational and educational purposes only. We do not claim any ownership over, nor do we intend to infringe upon, any trademarks, copyrights, logos, brand names, or other intellectual property mentioned or depicted on this site. Such intellectual property remains the property of its respective owners, and any references here are made solely for identification or informational purposes, without implying any affiliation, endorsement, or partnership.
We make no representations or warranties, express or implied, regarding the accuracy, completeness, or suitability of any content or products presented. Nothing on this website should be construed as legal, tax, investment, financial, medical, or other professional advice. In addition, no part of this site—including articles or product references—constitutes a solicitation, recommendation, endorsement, advertisement, or offer to buy or sell any securities, franchises, or other financial instruments, particularly in jurisdictions where such activity would be unlawful.
All content is of a general nature and may not address the specific circumstances of any individual or entity. It is not a substitute for professional advice or services. Any actions you take based on the information provided here are strictly at your own risk. You accept full responsibility for any decisions or outcomes arising from your use of this website and agree to release us from any liability in connection with your use of, or reliance upon, the content or products found herein.