
|
IndusInd Bank Limited (IndusIndBK.NS) Évaluation DCF |
Entièrement Modifiable: Adapté À Vos Besoins Dans Excel Ou Sheets
Conception Professionnelle: Modèles Fiables Et Conformes Aux Normes Du Secteur
Pré-Construits Pour Une Utilisation Rapide Et Efficace
Compatible MAC/PC, entièrement débloqué
Aucune Expertise N'Est Requise; Facile À Suivre
IndusInd Bank Limited (INDUSINDBK.NS) Bundle
Améliorez vos stratégies d'investissement avec la calculatrice DCF IndusInd Bank Limited (IndusIndBkns)! Explorez des données financières authentiques, ajustez les projections et les dépenses de croissance et observez instantanément comment ces modifications affectent la valeur intrinsèque de l'IndusInd Bank.
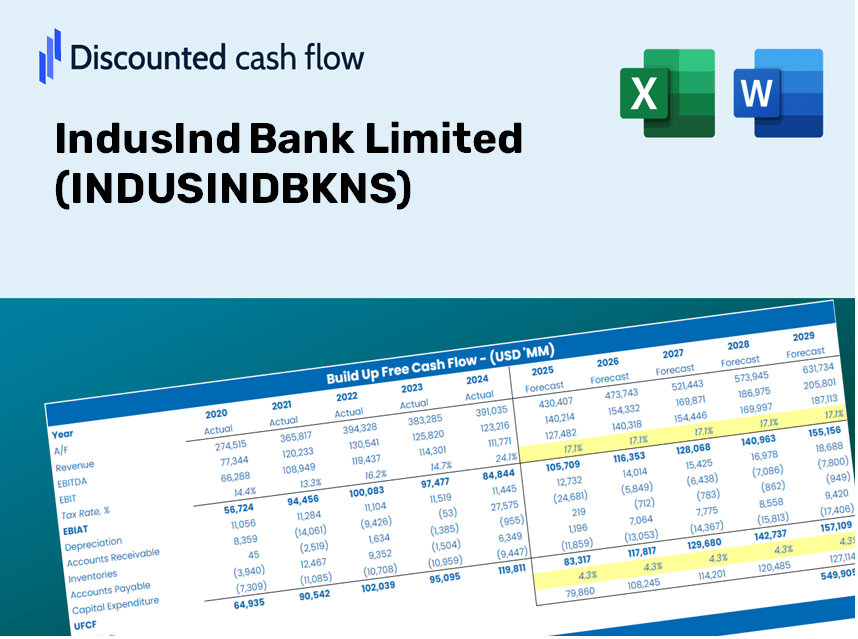
Discounted Cash Flow (DCF) - (USD MM)
| Year | AY1 2021 |
AY2 2022 |
AY3 2023 |
AY4 2024 |
AY5 2025 |
FY1 2026 |
FY2 2027 |
FY3 2028 |
FY4 2029 |
FY5 2030 |
|---|---|---|---|---|---|---|---|---|---|---|
| Revenue | 348,904.9 | 378,648.1 | 442,434.8 | 551,439.8 | 563,581.0 | 637,142.3 | 720,305.1 | 814,322.7 | 920,612.0 | 1,040,774.7 |
| Revenue Growth, % | 0 | 8.52 | 16.85 | 24.64 | 2.2 | 13.05 | 13.05 | 13.05 | 13.05 | 13.05 |
| EBITDA | 42,570.6 | 67,848.5 | 103,394.0 | 124,422.4 | 40,580.2 | 106,087.7 | 119,934.8 | 135,589.2 | 153,287.0 | 173,294.7 |
| EBITDA, % | 12.2 | 17.92 | 23.37 | 22.56 | 7.2 | 16.65 | 16.65 | 16.65 | 16.65 | 16.65 |
| Depreciation | 3,276.4 | 3,520.2 | 4,072.1 | 4,630.4 | 5,322.7 | 5,827.6 | 6,588.3 | 7,448.2 | 8,420.4 | 9,519.5 |
| Depreciation, % | 0.93906 | 0.92969 | 0.92038 | 0.83969 | 0.94444 | 0.91465 | 0.91465 | 0.91465 | 0.91465 | 0.91465 |
| EBIT | 39,294.2 | 64,328.2 | 99,321.9 | 119,792.0 | 35,257.5 | 100,260.1 | 113,346.5 | 128,141.0 | 144,866.6 | 163,775.2 |
| EBIT, % | 11.26 | 16.99 | 22.45 | 21.72 | 6.26 | 15.74 | 15.74 | 15.74 | 15.74 | 15.74 |
| Total Cash | 566,098.9 | 685,847.1 | 567,767.6 | 369,074.1 | 593,754.9 | 595,000.6 | 672,662.9 | 760,462.1 | 859,721.2 | 971,936.1 |
| Total Cash, percent | .0 | .0 | .0 | .0 | .0 | .0 | .0 | .0 | .0 | .0 |
| Account Receivables | 54,876.6 | 121,444.6 | 136,059.5 | 201,668.2 | 167,580.8 | 184,593.0 | 208,687.0 | 235,925.8 | 266,719.9 | 301,533.5 |
| Account Receivables, % | 15.73 | 32.07 | 30.75 | 36.57 | 29.73 | 28.97 | 28.97 | 28.97 | 28.97 | 28.97 |
| Inventories | .0 | -828,097.2 | -728,416.7 | .0 | .0 | -254,856.9 | -288,122.0 | -325,729.1 | -368,244.8 | -416,309.9 |
| Inventories, % | 0 | -218.7 | -164.64 | 0 | 0 | -40 | -40 | -40 | -40 | -40 |
| Accounts Payable | 14,508.1 | 13,110.2 | 18,302.9 | 19,426.1 | 26,207.2 | 25,396.9 | 28,711.9 | 32,459.5 | 36,696.2 | 41,486.0 |
| Accounts Payable, % | 4.16 | 3.46 | 4.14 | 3.52 | 4.65 | 3.99 | 3.99 | 3.99 | 3.99 | 3.99 |
| Capital Expenditure | -3,412.0 | -4,143.0 | -5,710.9 | -7,300.1 | -7,309.9 | -7,625.0 | -8,620.2 | -9,745.4 | -11,017.4 | -12,455.4 |
| Capital Expenditure, % | -0.97792 | -1.09 | -1.29 | -1.32 | -1.3 | -1.2 | -1.2 | -1.2 | -1.2 | -1.2 |
| Tax Rate, % | 26.95 | 26.95 | 26.95 | 26.95 | 26.95 | 26.95 | 26.95 | 26.95 | 26.95 | 26.95 |
| EBITAT | 29,301.0 | 48,050.4 | 74,434.9 | 89,773.0 | 25,755.4 | 74,633.0 | 84,374.5 | 95,387.4 | 107,837.8 | 121,913.3 |
| Depreciation | ||||||||||
| Changes in Account Receivables | ||||||||||
| Changes in Inventories | ||||||||||
| Changes in Accounts Payable | ||||||||||
| Capital Expenditure | ||||||||||
| UFCF | -11,203.1 | 807,559.0 | -36,306.6 | -705,799.0 | 64,636.8 | 309,870.0 | 94,828.6 | 107,206.1 | 121,199.2 | 137,018.7 |
| WACC, % | 23.14 | 23.17 | 23.24 | 23.24 | 22.73 | 23.1 | 23.1 | 23.1 | 23.1 | 23.1 |
| PV UFCF | ||||||||||
| SUM PV UFCF | 473,006.3 | |||||||||
| Long Term Growth Rate, % | 2.00 | |||||||||
| Free cash flow (T + 1) | 139,759 | |||||||||
| Terminal Value | 662,302 | |||||||||
| Present Terminal Value | 234,278 | |||||||||
| Enterprise Value | 707,284 | |||||||||
| Net Debt | -56,719 | |||||||||
| Equity Value | 764,003 | |||||||||
| Diluted Shares Outstanding, MM | 779 | |||||||||
| Equity Value Per Share | 980.39 |
Benefits You Will Receive
- Customizable Excel Template: A fully adjustable Excel-based DCF Calculator featuring pre-filled financial data for IndusInd Bank Limited (INDUSINDBKNS).
- Up-to-Date Financial Data: Access to historical performance metrics and forward-looking estimates (highlighted in the yellow cells).
- Flexible Forecasting: Modify key assumptions such as revenue growth, EBITDA margin, and WACC as needed.
- Instant Calculations: Quickly evaluate how your inputs influence the valuation of IndusInd Bank Limited (INDUSINDBKNS).
- Professional Resource: Designed for use by investors, CFOs, consultants, and financial analysts.
- Intuitive Layout: Organized for easy navigation and comprehension, accompanied by detailed instructions.
Key Features
- 🔍 Real-Life INDUSINDBKNS Financials: Pre-filled historical and projected data for IndusInd Bank Limited.
- ✏️ Fully Customizable Inputs: Adjust all critical parameters (yellow cells) such as WACC, growth %, and tax rates.
- 📊 Professional DCF Valuation: Utilize built-in formulas to determine IndusInd Bank's intrinsic value using the Discounted Cash Flow method.
- ⚡ Instant Results: Visualize IndusInd Bank’s valuation immediately after making adjustments.
- Scenario Analysis: Evaluate and compare outcomes for various financial assumptions side-by-side.
How It Works
- 1. Access the Template: Download and open the Excel file containing IndusInd Bank Limited's preloaded data.
- 2. Modify Assumptions: Adjust key inputs such as growth rates, WACC, and capital expenditure values.
- 3. Instant Results: The DCF model automatically computes intrinsic value and NPV in real-time.
- 4. Explore Scenarios: Analyze various forecasts to evaluate different valuation results.
- 5. Present with Assurance: Deliver professional valuation insights to strengthen your decision-making process.
Why Opt for IndusInd Bank Limited (INDUSINDBKNS)?
- Time-Saving: Get started instantly without the hassle of building a financial model from the ground up.
- Enhanced Precision: Utilize reliable financial data and formulas to minimize valuation errors.
- Completely Customizable: Adjust the model to suit your specific assumptions and forecasts.
- Simple to Analyze: Intuitive charts and outputs facilitate straightforward interpretation of results.
- Endorsed by Professionals: Crafted for experts who prioritize accuracy and user-friendliness.
Who Can Benefit from This Product?
- Investors: Evaluate IndusInd Bank Limited’s (INDUSINDBKNS) valuation prior to making stock transactions.
- CFOs and Financial Analysts: Optimize valuation procedures and assess financial forecasts.
- Startup Founders: Understand how leading publicly traded banks, such as IndusInd Bank, are valued.
- Consultants: Create comprehensive valuation reports for your clientele.
- Students and Educators: Utilize real-time data for practicing and teaching valuation methodologies.
Contents of the Template
- Pre-Filled DCF Model: IndusInd Bank’s financial data preloaded for immediate application.
- WACC Calculator: Comprehensive calculations for Weighted Average Cost of Capital.
- Financial Ratios: Assess IndusInd Bank’s profitability, leverage, and efficiency.
- Editable Inputs: Modify assumptions such as growth, margins, and CAPEX to suit your scenarios.
- Financial Statements: Access annual and quarterly reports for in-depth analysis.
- Interactive Dashboard: Effortlessly visualize key valuation metrics and outcomes.
Disclaimer
All information, articles, and product details provided on this website are for general informational and educational purposes only. We do not claim any ownership over, nor do we intend to infringe upon, any trademarks, copyrights, logos, brand names, or other intellectual property mentioned or depicted on this site. Such intellectual property remains the property of its respective owners, and any references here are made solely for identification or informational purposes, without implying any affiliation, endorsement, or partnership.
We make no representations or warranties, express or implied, regarding the accuracy, completeness, or suitability of any content or products presented. Nothing on this website should be construed as legal, tax, investment, financial, medical, or other professional advice. In addition, no part of this site—including articles or product references—constitutes a solicitation, recommendation, endorsement, advertisement, or offer to buy or sell any securities, franchises, or other financial instruments, particularly in jurisdictions where such activity would be unlawful.
All content is of a general nature and may not address the specific circumstances of any individual or entity. It is not a substitute for professional advice or services. Any actions you take based on the information provided here are strictly at your own risk. You accept full responsibility for any decisions or outcomes arising from your use of this website and agree to release us from any liability in connection with your use of, or reliance upon, the content or products found herein.