
|
Ingersoll-Rand Limited (ingerrand.NS) Valation DCF |
Entièrement Modifiable: Adapté À Vos Besoins Dans Excel Ou Sheets
Conception Professionnelle: Modèles Fiables Et Conformes Aux Normes Du Secteur
Pré-Construits Pour Une Utilisation Rapide Et Efficace
Compatible MAC/PC, entièrement débloqué
Aucune Expertise N'Est Requise; Facile À Suivre
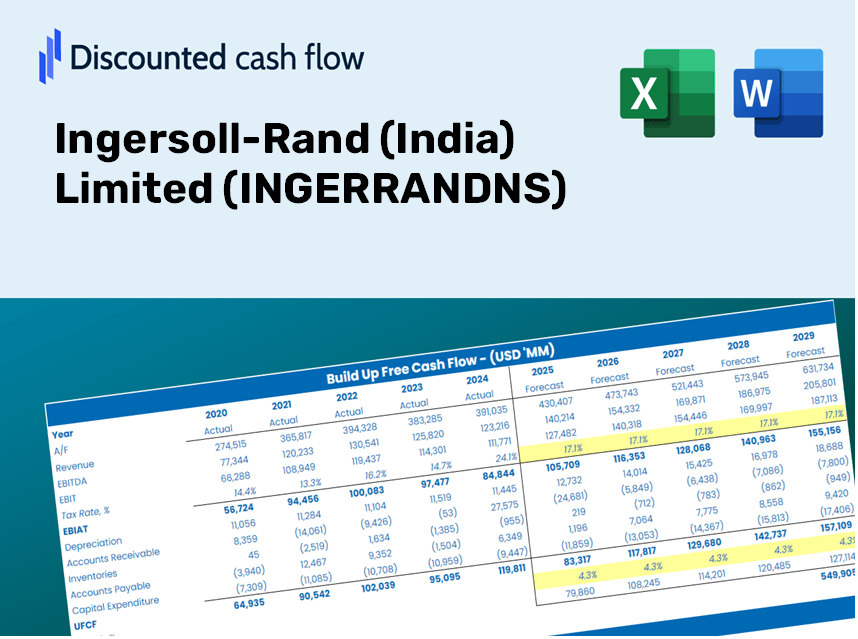
Ingersoll-Rand (India) Limited (INGERRAND.NS) Bundle
Gardez un aperçu de votre analyse d'évaluation Ingersoll-Rand (Inde) Limited (InGerrandns) à l'aide de notre calculatrice sophistiquée DCF! Ce modèle Excel est préchargé avec des données réelles d'ingérandns, vous permettant d'ajuster les prévisions et les hypothèses pour déterminer avec précision la valeur intrinsèque d'Ingersoll-Rand (Inde) Limited.
Discounted Cash Flow (DCF) - (USD MM)
| Year | AY1 2021 |
AY2 2022 |
AY3 2023 |
AY4 2024 |
AY5 2025 |
FY1 2026 |
FY2 2027 |
FY3 2028 |
FY4 2029 |
FY5 2030 |
|---|---|---|---|---|---|---|---|---|---|---|
| Revenue | 6,177.3 | 9,099.2 | 11,507.9 | 11,981.4 | 13,362.9 | 16,350.1 | 20,005.1 | 24,477.1 | 29,948.8 | 36,643.7 |
| Revenue Growth, % | 0 | 47.3 | 26.47 | 4.11 | 11.53 | 22.35 | 22.35 | 22.35 | 22.35 | 22.35 |
| EBITDA | 1,145.6 | 1,537.8 | 2,484.8 | 2,955.9 | 3,641.5 | 3,563.0 | 4,359.5 | 5,334.0 | 6,526.4 | 7,985.4 |
| EBITDA, % | 18.55 | 16.9 | 21.59 | 24.67 | 27.25 | 21.79 | 21.79 | 21.79 | 21.79 | 21.79 |
| Depreciation | 100.4 | 108.6 | 128.7 | 142.8 | 141.6 | 202.4 | 247.6 | 302.9 | 370.7 | 453.5 |
| Depreciation, % | 1.63 | 1.19 | 1.12 | 1.19 | 1.06 | 1.24 | 1.24 | 1.24 | 1.24 | 1.24 |
| EBIT | 1,045.2 | 1,429.2 | 2,356.2 | 2,813.1 | 3,499.9 | 3,360.6 | 4,111.9 | 5,031.1 | 6,155.8 | 7,531.8 |
| EBIT, % | 16.92 | 15.71 | 20.47 | 23.48 | 26.19 | 20.55 | 20.55 | 20.55 | 20.55 | 20.55 |
| Total Cash | 2,291.7 | 2,916.9 | 2,729.5 | 2,203.7 | 2,116.7 | 4,156.4 | 5,085.5 | 6,222.4 | 7,613.3 | 9,315.2 |
| Total Cash, percent | .0 | .0 | .0 | .0 | .0 | .0 | .0 | .0 | .0 | .0 |
| Account Receivables | 1,855.4 | 2,226.7 | 2,718.9 | 2,534.3 | 3,005.2 | 3,982.1 | 4,872.2 | 5,961.4 | 7,294.0 | 8,924.6 |
| Account Receivables, % | 30.04 | 24.47 | 23.63 | 21.15 | 22.49 | 24.35 | 24.35 | 24.35 | 24.35 | 24.35 |
| Inventories | 950.0 | 1,607.3 | 1,620.9 | 1,747.4 | 1,733.3 | 2,442.2 | 2,988.1 | 3,656.1 | 4,473.4 | 5,473.4 |
| Inventories, % | 15.38 | 17.66 | 14.09 | 14.58 | 12.97 | 14.94 | 14.94 | 14.94 | 14.94 | 14.94 |
| Accounts Payable | 1,424.1 | 1,998.1 | 1,939.7 | 1,572.1 | 2,164.7 | 2,981.9 | 3,648.5 | 4,464.0 | 5,462.0 | 6,682.9 |
| Accounts Payable, % | 23.05 | 21.96 | 16.86 | 13.12 | 16.2 | 18.24 | 18.24 | 18.24 | 18.24 | 18.24 |
| Capital Expenditure | -66.8 | -122.5 | -148.3 | -488.0 | -489.5 | -374.5 | -458.2 | -560.7 | -686.0 | -839.3 |
| Capital Expenditure, % | -1.08 | -1.35 | -1.29 | -4.07 | -3.66 | -2.29 | -2.29 | -2.29 | -2.29 | -2.29 |
| Tax Rate, % | 25.76 | 25.76 | 25.76 | 25.76 | 25.76 | 25.76 | 25.76 | 25.76 | 25.76 | 25.76 |
| EBITAT | 701.7 | 1,061.1 | 1,747.2 | 2,099.0 | 2,598.4 | 2,449.1 | 2,996.6 | 3,666.5 | 4,486.1 | 5,489.0 |
| Depreciation | ||||||||||
| Changes in Account Receivables | ||||||||||
| Changes in Inventories | ||||||||||
| Changes in Accounts Payable | ||||||||||
| Capital Expenditure | ||||||||||
| UFCF | -646.2 | 592.7 | 1,163.4 | 1,444.4 | 2,386.2 | 1,408.4 | 2,016.5 | 2,467.2 | 3,018.8 | 3,693.6 |
| WACC, % | 4.53 | 4.53 | 4.53 | 4.53 | 4.53 | 4.53 | 4.53 | 4.53 | 4.53 | 4.53 |
| PV UFCF | ||||||||||
| SUM PV UFCF | 10,839.9 | |||||||||
| Long Term Growth Rate, % | 4.00 | |||||||||
| Free cash flow (T + 1) | 3,841 | |||||||||
| Terminal Value | 719,521 | |||||||||
| Present Terminal Value | 576,445 | |||||||||
| Enterprise Value | 587,285 | |||||||||
| Net Debt | -2,011 | |||||||||
| Equity Value | 589,297 | |||||||||
| Diluted Shares Outstanding, MM | 32 | |||||||||
| Equity Value Per Share | 18,667.53 |
What You'll Receive
- Genuine INGERRANDNS Financial Data: Access to both historical and projected figures for precise valuation.
- Customizable Inputs: Adjust parameters such as WACC, tax rates, revenue growth, and capital expenditures.
- Instant Calculations: Intrinsic value and NPV are computed in real-time.
- Scenario Evaluation: Analyze various scenarios to assess Ingerrand's potential future performance.
- User-Friendly Design: Tailored for industry professionals while remaining approachable for newcomers.
Key Features
- Real-Time INGERRANDNS Data: Pre-filled with Ingersoll-Rand (India) Limited’s historical financials and future projections.
- Comprehensive Customization Options: Tailor revenue growth, profit margins, WACC, tax rates, and capital expenditures to fit your analysis.
- Adaptive Valuation Model: Automatically refreshes Net Present Value (NPV) and intrinsic value as per your input parameters.
- Scenario Analysis: Develop multiple forecasting scenarios to evaluate diverse valuation outcomes.
- Intuitive User Interface: Designed to be straightforward and accessible for both seasoned professionals and newcomers.
How It Functions
- Step 1: Download the Excel template.
- Step 2: Examine the pre-filled financial data and projections for Ingersoll-Rand (India) Limited (INGERRANDNS).
- Step 3: Adjust key variables such as revenue growth, WACC, and tax rates (highlighted cells).
- Step 4: Observe the DCF model refresh in real-time as you modify your assumptions.
- Step 5: Review the results and leverage the insights for making informed investment decisions.
Why Opt for This Calculator?
- Precise Data: Authentic Ingersoll-Rand (India) Limited financials provide dependable valuation outcomes.
- Tailorable: Modify essential parameters such as growth rates, WACC, and tax rates to align with your forecasts.
- Efficient: Ready-to-use calculations save you the effort of beginning from scratch.
- Expert-Quality Tool: Crafted for investors, analysts, and consultants.
- Accessible: User-friendly design and clear step-by-step guidance make it suitable for all users.
Who Should Use This Product?
- Investors: Accurately assess the fair value of Ingersoll-Rand (India) Limited (INGERRANDNS) before making investment choices.
- CFOs: Utilize a sophisticated DCF model for financial reporting and in-depth analysis.
- Consultants: Effortlessly customize the template for client valuation reports.
- Entrepreneurs: Acquire valuable insights into financial modeling practices employed by leading companies.
- Educators: Employ it as a resource to illustrate various valuation techniques.
Overview of the Template Contents
- Preloaded INGERRANDNS Data: Historical and projected financial metrics, including revenue, EBIT, and capital expenditures.
- DCF and WACC Models: High-caliber spreadsheets for computing intrinsic value and Weighted Average Cost of Capital.
- Editable Inputs: Yellow-highlighted cells for modifying revenue growth, tax rates, and discount rates.
- Financial Statements: Detailed annual and quarterly financial reports for in-depth analysis.
- Key Ratios: Metrics on profitability, leverage, and efficiency to assess financial performance.
- Dashboard and Charts: Visual representations of valuation results and underlying assumptions.
Disclaimer
All information, articles, and product details provided on this website are for general informational and educational purposes only. We do not claim any ownership over, nor do we intend to infringe upon, any trademarks, copyrights, logos, brand names, or other intellectual property mentioned or depicted on this site. Such intellectual property remains the property of its respective owners, and any references here are made solely for identification or informational purposes, without implying any affiliation, endorsement, or partnership.
We make no representations or warranties, express or implied, regarding the accuracy, completeness, or suitability of any content or products presented. Nothing on this website should be construed as legal, tax, investment, financial, medical, or other professional advice. In addition, no part of this site—including articles or product references—constitutes a solicitation, recommendation, endorsement, advertisement, or offer to buy or sell any securities, franchises, or other financial instruments, particularly in jurisdictions where such activity would be unlawful.
All content is of a general nature and may not address the specific circumstances of any individual or entity. It is not a substitute for professional advice or services. Any actions you take based on the information provided here are strictly at your own risk. You accept full responsibility for any decisions or outcomes arising from your use of this website and agree to release us from any liability in connection with your use of, or reliance upon, the content or products found herein.