
|
INSMED Incorporated (INSM) Évaluation DCF |
Entièrement Modifiable: Adapté À Vos Besoins Dans Excel Ou Sheets
Conception Professionnelle: Modèles Fiables Et Conformes Aux Normes Du Secteur
Pré-Construits Pour Une Utilisation Rapide Et Efficace
Compatible MAC/PC, entièrement débloqué
Aucune Expertise N'Est Requise; Facile À Suivre
Insmed Incorporated (INSM) Bundle
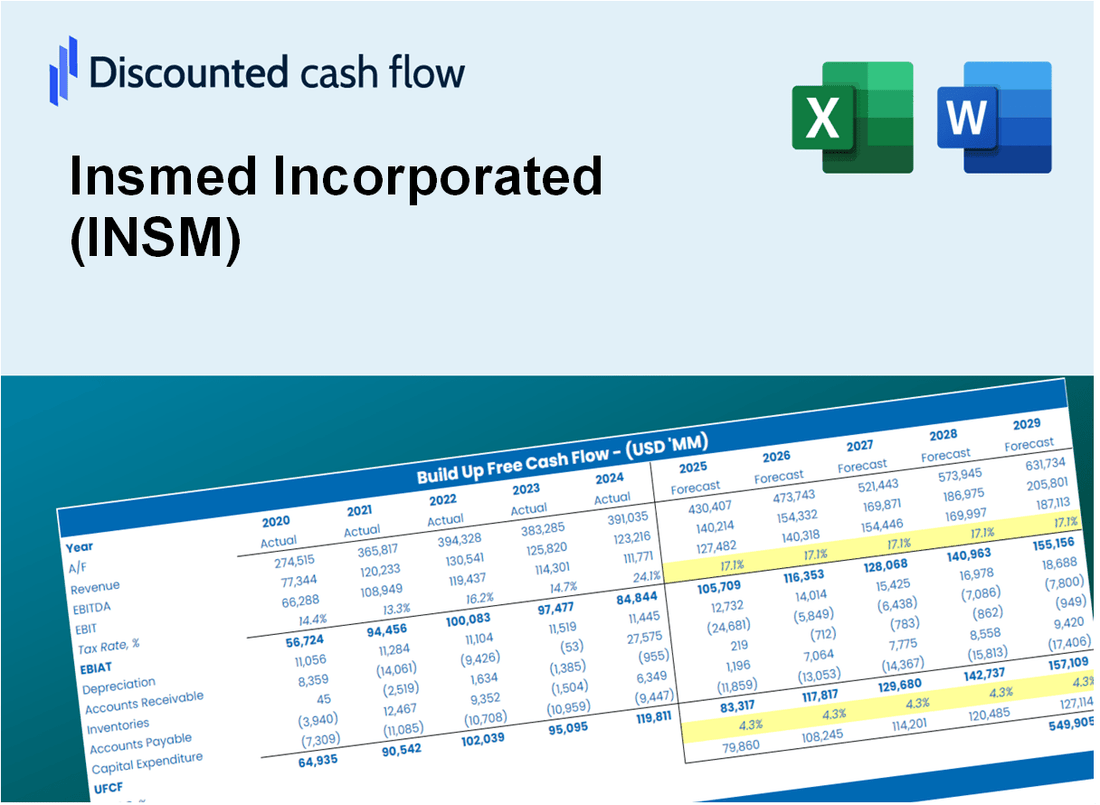
Découvrez le véritable potentiel d'Insmed Incorporated (INSM) avec notre calculatrice avancée DCF! Ajustez les hypothèses clés, explorez divers scénarios et évaluez comment les changements affectent l'incorporation INSMED (INSM) - le tout dans un modèle Excel.
Discounted Cash Flow (DCF) - (USD MM)
| Year | AY1 2020 |
AY2 2021 |
AY3 2022 |
AY4 2023 |
AY5 2024 |
FY1 2025 |
FY2 2026 |
FY3 2027 |
FY4 2028 |
FY5 2029 |
|---|---|---|---|---|---|---|---|---|---|---|
| Revenue | 164.4 | 188.5 | 245.4 | 305.2 | 363.7 | 444.1 | 542.2 | 662.0 | 808.2 | 986.8 |
| Revenue Growth, % | 0 | 14.63 | 30.19 | 24.39 | 19.17 | 22.09 | 22.09 | 22.09 | 22.09 | 22.09 |
| EBITDA | -250.4 | -383.6 | -447.4 | -660.2 | -818.8 | -444.1 | -542.2 | -662.0 | -808.2 | -986.8 |
| EBITDA, % | -152.28 | -203.57 | -182.33 | -216.3 | -225.12 | -100 | -100 | -100 | -100 | -100 |
| Depreciation | 14.2 | 14.2 | 10.3 | 10.6 | 11.0 | 23.8 | 29.1 | 35.5 | 43.4 | 53.0 |
| Depreciation, % | 8.61 | 7.53 | 4.21 | 3.47 | 3.03 | 5.37 | 5.37 | 5.37 | 5.37 | 5.37 |
| EBIT | -264.5 | -397.8 | -457.7 | -670.8 | -829.8 | -444.1 | -542.2 | -662.0 | -808.2 | -986.8 |
| EBIT, % | -160.89 | -211.09 | -186.54 | -219.77 | -228.15 | -100 | -100 | -100 | -100 | -100 |
| Total Cash | 532.8 | 716.8 | 1,148.3 | 780.4 | 1,433.8 | 444.1 | 542.2 | 662.0 | 808.2 | 986.8 |
| Total Cash, percent | .0 | .0 | .0 | .0 | .0 | .0 | .0 | .0 | .0 | .0 |
| Account Receivables | 16.6 | 24.4 | 29.7 | 41.2 | 52.0 | 55.9 | 68.2 | 83.3 | 101.7 | 124.1 |
| Account Receivables, % | 10.07 | 12.92 | 12.11 | 13.5 | 14.3 | 12.58 | 12.58 | 12.58 | 12.58 | 12.58 |
| Inventories | 49.6 | 67.0 | 69.9 | 83.2 | 98.6 | 132.0 | 161.1 | 196.7 | 240.2 | 293.3 |
| Inventories, % | 30.16 | 35.56 | 28.5 | 27.28 | 27.1 | 29.72 | 29.72 | 29.72 | 29.72 | 29.72 |
| Accounts Payable | 42.9 | 35.8 | 50.5 | 65.4 | 73.0 | 95.1 | 116.2 | 141.8 | 173.2 | 211.4 |
| Accounts Payable, % | 26.06 | 18.99 | 20.57 | 21.43 | 20.08 | 21.42 | 21.42 | 21.42 | 21.42 | 21.42 |
| Capital Expenditure | -6.8 | -7.3 | -9.9 | -13.3 | -21.9 | -19.9 | -24.3 | -29.7 | -36.2 | -44.3 |
| Capital Expenditure, % | -4.15 | -3.87 | -4.03 | -4.35 | -6.03 | -4.48 | -4.48 | -4.48 | -4.48 | -4.48 |
| Tax Rate, % | -0.40733 | -0.40733 | -0.40733 | -0.40733 | -0.40733 | -0.40733 | -0.40733 | -0.40733 | -0.40733 | -0.40733 |
| EBITAT | -265.8 | -396.2 | -459.0 | -673.1 | -833.2 | -443.7 | -541.7 | -661.4 | -807.6 | -986.0 |
| Depreciation | ||||||||||
| Changes in Account Receivables | ||||||||||
| Changes in Inventories | ||||||||||
| Changes in Accounts Payable | ||||||||||
| Capital Expenditure | ||||||||||
| UFCF | -281.8 | -421.6 | -452.2 | -685.6 | -862.6 | -454.9 | -557.4 | -680.6 | -831.0 | -1,014.6 |
| WACC, % | 8.48 | 8.48 | 8.48 | 8.48 | 8.48 | 8.48 | 8.48 | 8.48 | 8.48 | 8.48 |
| PV UFCF | ||||||||||
| SUM PV UFCF | -2,701.2 | |||||||||
| Long Term Growth Rate, % | 2.00 | |||||||||
| Free cash flow (T + 1) | -1,035 | |||||||||
| Terminal Value | -15,959 | |||||||||
| Present Terminal Value | -10,621 | |||||||||
| Enterprise Value | -13,322 | |||||||||
| Net Debt | 759 | |||||||||
| Equity Value | -14,081 | |||||||||
| Diluted Shares Outstanding, MM | 164 | |||||||||
| Equity Value Per Share | -85.84 |
What You Will Receive
- Flexible Forecast Inputs: Effortlessly modify assumptions (growth %, margins, WACC) to explore various scenarios.
- Real-World Data: Insmed Incorporated’s financial data pre-loaded to facilitate your analysis.
- Automated DCF Outputs: The template computes Net Present Value (NPV) and intrinsic value automatically for you.
- Customizable and Professional: A refined Excel model that adjusts to your valuation requirements.
- Designed for Analysts and Investors: Perfect for evaluating projections, confirming strategies, and enhancing efficiency.
Key Features
- Comprehensive Financial Insights: Gain access to precise historical data and future forecasts for Insmed Incorporated (INSM).
- Tailored Projection Inputs: Modify highlighted fields such as WACC, growth rates, and profit margins to suit your analysis.
- Real-Time Calculations: Experience automatic updates for DCF, Net Present Value (NPV), and cash flow evaluations.
- Interactive Dashboard: Utilize intuitive charts and summaries to effectively visualize your valuation outcomes.
- Designed for All Users: A user-friendly layout catered to investors, CFOs, and consultants alike.
How It Works
- Download: Obtain the pre-built Excel file containing Insmed Incorporated’s (INSM) financial data.
- Customize: Modify assumptions, such as revenue projections, EBITDA %, and WACC.
- Update Automatically: The intrinsic value and NPV calculations refresh in real-time.
- Test Scenarios: Generate various forecasts and analyze results instantly.
- Make Decisions: Leverage the valuation insights to inform your investment choices.
Why Choose This Calculator for Insmed Incorporated (INSM)?
- Designed for Experts: A specialized tool utilized by investment analysts, CFOs, and healthcare consultants.
- Accurate Financial Data: Insmed’s historical and projected financials are preloaded for precise calculations.
- Flexible Scenario Analysis: Effortlessly simulate various forecasts and assumptions.
- Comprehensive Outputs: Automatically calculates intrinsic value, NPV, and essential financial metrics.
- User-Friendly Interface: Step-by-step guidance ensures a smooth calculation experience.
Who Should Use This Product?
- Professional Investors: Develop comprehensive and accurate valuation models for assessing investments in Insmed Incorporated (INSM).
- Corporate Finance Teams: Evaluate valuation scenarios to inform strategic decisions within their organizations.
- Consultants and Advisors: Deliver precise valuation insights to clients interested in Insmed Incorporated (INSM) stock.
- Students and Educators: Utilize real-time data to enhance learning and practice in financial modeling related to Insmed Incorporated (INSM).
- Healthcare Enthusiasts: Gain insights into how biotech companies like Insmed Incorporated (INSM) are valued in the financial markets.
What the Template Contains
- Pre-Filled Data: Contains Insmed Incorporated's historical financials and projections.
- Discounted Cash Flow Model: Editable DCF valuation model with real-time calculations.
- Weighted Average Cost of Capital (WACC): A dedicated sheet for calculating WACC based on user-defined inputs.
- Key Financial Ratios: Assess Insmed's profitability, efficiency, and financial leverage.
- Customizable Inputs: Easily modify revenue growth, profit margins, and tax rates.
- Clear Dashboard: Visual representations and tables summarizing essential valuation outcomes.
Disclaimer
All information, articles, and product details provided on this website are for general informational and educational purposes only. We do not claim any ownership over, nor do we intend to infringe upon, any trademarks, copyrights, logos, brand names, or other intellectual property mentioned or depicted on this site. Such intellectual property remains the property of its respective owners, and any references here are made solely for identification or informational purposes, without implying any affiliation, endorsement, or partnership.
We make no representations or warranties, express or implied, regarding the accuracy, completeness, or suitability of any content or products presented. Nothing on this website should be construed as legal, tax, investment, financial, medical, or other professional advice. In addition, no part of this site—including articles or product references—constitutes a solicitation, recommendation, endorsement, advertisement, or offer to buy or sell any securities, franchises, or other financial instruments, particularly in jurisdictions where such activity would be unlawful.
All content is of a general nature and may not address the specific circumstances of any individual or entity. It is not a substitute for professional advice or services. Any actions you take based on the information provided here are strictly at your own risk. You accept full responsibility for any decisions or outcomes arising from your use of this website and agree to release us from any liability in connection with your use of, or reliance upon, the content or products found herein.