
|
IPSEN S.A. (IPN.PA) Évaluation DCF |
Entièrement Modifiable: Adapté À Vos Besoins Dans Excel Ou Sheets
Conception Professionnelle: Modèles Fiables Et Conformes Aux Normes Du Secteur
Pré-Construits Pour Une Utilisation Rapide Et Efficace
Compatible MAC/PC, entièrement débloqué
Aucune Expertise N'Est Requise; Facile À Suivre
Ipsen S.A. (IPN.PA) Bundle
Conçu pour la précision, notre calculatrice DCF (IPNPA) vous permet d'évaluer l'évaluation IPSEN S.A. à l'aide de données financières réelles tout en offrant une flexibilité complète pour modifier tous les paramètres clés pour des projections améliorées.
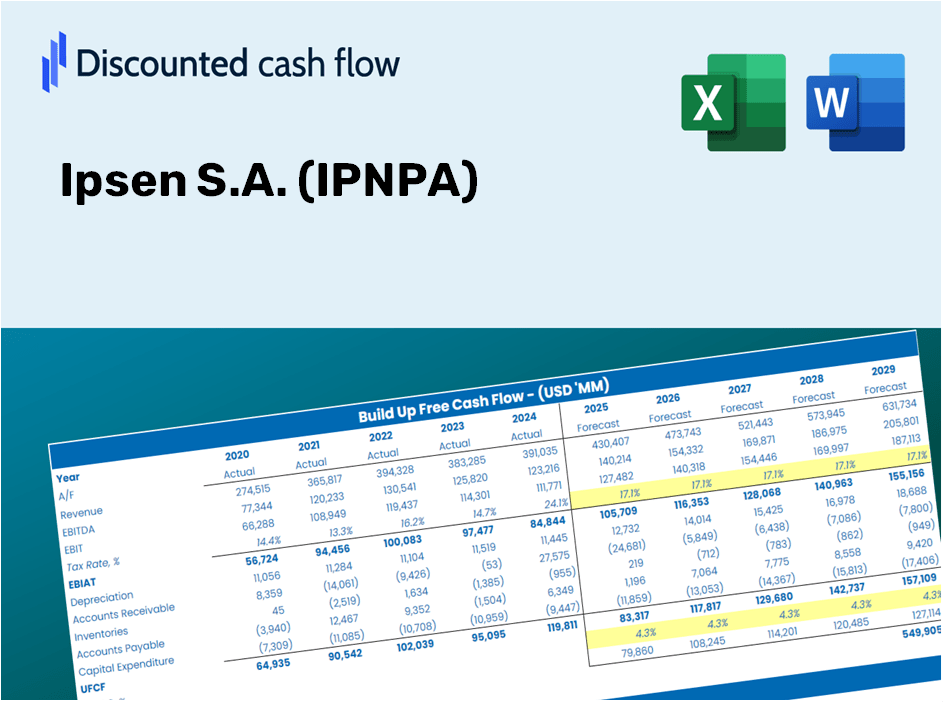
Discounted Cash Flow (DCF) - (USD MM)
| Year | AY1 2020 |
AY2 2021 |
AY3 2022 |
AY4 2023 |
AY5 2024 |
FY1 2025 |
FY2 2026 |
FY3 2027 |
FY4 2028 |
FY5 2029 |
|---|---|---|---|---|---|---|---|---|---|---|
| Revenue | 2,686.2 | 2,748.6 | 3,156.4 | 3,306.4 | 3,574.5 | 3,842.8 | 4,131.2 | 4,441.2 | 4,774.5 | 5,132.9 |
| Revenue Growth, % | 0 | 2.32 | 14.84 | 4.75 | 8.11 | 7.51 | 7.51 | 7.51 | 7.51 | 7.51 |
| EBITDA | 794.4 | 1,059.2 | 1,130.9 | 1,143.0 | 1,161.3 | 1,314.2 | 1,412.8 | 1,518.9 | 1,632.9 | 1,755.4 |
| EBITDA, % | 29.57 | 38.54 | 35.83 | 34.57 | 32.49 | 34.2 | 34.2 | 34.2 | 34.2 | 34.2 |
| Depreciation | 234.7 | 246.4 | 201.3 | 282.0 | 705.9 | 402.4 | 432.6 | 465.1 | 500.0 | 537.5 |
| Depreciation, % | 8.74 | 8.96 | 6.38 | 8.53 | 19.75 | 10.47 | 10.47 | 10.47 | 10.47 | 10.47 |
| EBIT | 559.7 | 812.8 | 929.6 | 861.0 | 455.4 | 911.8 | 980.2 | 1,053.8 | 1,132.9 | 1,217.9 |
| EBIT, % | 20.84 | 29.57 | 29.45 | 26.04 | 12.74 | 23.73 | 23.73 | 23.73 | 23.73 | 23.73 |
| Total Cash | 642.5 | 814.7 | 1,169.3 | 528.4 | 679.2 | 965.2 | 1,037.6 | 1,115.5 | 1,199.2 | 1,289.2 |
| Total Cash, percent | .0 | .0 | .0 | .0 | .0 | .0 | .0 | .0 | .0 | .0 |
| Account Receivables | 498.6 | 587.7 | 670.8 | 631.3 | 697.2 | 767.0 | 824.5 | 886.4 | 952.9 | 1,024.5 |
| Account Receivables, % | 18.56 | 21.38 | 21.25 | 19.09 | 19.5 | 19.96 | 19.96 | 19.96 | 19.96 | 19.96 |
| Inventories | 213.9 | 219.4 | 284.1 | 289.5 | 285.5 | 320.4 | 344.4 | 370.3 | 398.1 | 428.0 |
| Inventories, % | 7.96 | 7.98 | 9 | 8.76 | 7.99 | 8.34 | 8.34 | 8.34 | 8.34 | 8.34 |
| Accounts Payable | 495.2 | 594.7 | 647.1 | 771.4 | 854.8 | 828.6 | 890.8 | 957.7 | 1,029.6 | 1,106.8 |
| Accounts Payable, % | 18.43 | 21.64 | 20.5 | 23.33 | 23.91 | 21.56 | 21.56 | 21.56 | 21.56 | 21.56 |
| Capital Expenditure | -140.7 | -417.9 | -252.9 | -116.2 | -782.5 | -413.9 | -445.0 | -478.4 | -514.3 | -552.9 |
| Capital Expenditure, % | -5.24 | -15.2 | -8.01 | -3.51 | -21.89 | -10.77 | -10.77 | -10.77 | -10.77 | -10.77 |
| Tax Rate, % | 19.97 | 19.97 | 19.97 | 19.97 | 19.97 | 19.97 | 19.97 | 19.97 | 19.97 | 19.97 |
| EBITAT | 577.5 | 665.7 | 856.0 | 733.8 | 364.5 | 801.0 | 861.1 | 925.7 | 995.2 | 1,069.9 |
| Depreciation | ||||||||||
| Changes in Account Receivables | ||||||||||
| Changes in Inventories | ||||||||||
| Changes in Accounts Payable | ||||||||||
| Capital Expenditure | ||||||||||
| UFCF | 454.2 | 499.1 | 709.0 | 1,058.0 | 309.4 | 658.6 | 829.3 | 891.5 | 958.4 | 1,030.4 |
| WACC, % | 4.58 | 4.54 | 4.56 | 4.54 | 4.53 | 4.55 | 4.55 | 4.55 | 4.55 | 4.55 |
| PV UFCF | ||||||||||
| SUM PV UFCF | 3,795.8 | |||||||||
| Long Term Growth Rate, % | 2.00 | |||||||||
| Free cash flow (T + 1) | 1,051 | |||||||||
| Terminal Value | 41,220 | |||||||||
| Present Terminal Value | 32,999 | |||||||||
| Enterprise Value | 36,794 | |||||||||
| Net Debt | -251 | |||||||||
| Equity Value | 37,046 | |||||||||
| Diluted Shares Outstanding, MM | 83 | |||||||||
| Equity Value Per Share | 444.24 |
What You Will Receive
- Flexible Forecast Inputs: Effortlessly adjust parameters (growth %, margins, WACC) to explore various scenarios.
- Real-World Data: Ipsen S.A.’s financial data pre-loaded to facilitate your analysis.
- Automatic DCF Calculations: The template computes Net Present Value (NPV) and intrinsic value automatically for your convenience.
- Customizable and Professional Design: A sleek Excel model that can be tailored to meet your valuation requirements.
- Designed for Analysts and Investors: Perfect for evaluating forecasts, validating strategies, and saving valuable time.
Key Features
- Customizable Forecast Inputs: Adjust essential parameters such as revenue growth, EBITDA margin, and capital investments.
- Instant DCF Valuation: Quickly computes intrinsic value, NPV, and other key metrics.
- High-Precision Accuracy: Leverages Ipsen S.A.'s real financial data for credible valuation insights.
- Simplified Scenario Analysis: Effortlessly explore different scenarios and assess their impacts.
- Efficiency Booster: Remove the hassle of constructing complex valuation models from the ground up.
How It Works
- 1. Access the Template: Download and open the Excel file featuring Ipsen S.A.'s preloaded data.
- 2. Modify Assumptions: Adjust key inputs such as growth rates, WACC, and capital expenditures.
- 3. View Results Instantly: The DCF model automatically computes intrinsic value and NPV.
- 4. Explore Scenarios: Compare various forecasts to evaluate different valuation scenarios.
- 5. Present with Confidence: Offer professional valuation insights to inform your decisions regarding Ipsen S.A. (IPNPA).
Why Choose the Ipsen S.A. (IPNPA) Calculator?
- Precision: Leverages real Ipsen financial data for reliable results.
- Adaptability: Allows users to easily test and adjust inputs as needed.
- Efficiency: Eliminate the complexity of creating a DCF model from the ground up.
- Expert-Level: Crafted with the standards of CFOs to ensure both accuracy and usability.
- Intuitive: Simple to navigate, even for those without extensive financial modeling skills.
Who Can Benefit from Ipsen S.A. (IPNPA)?
- Investors: Make informed decisions with a top-tier valuation tool tailored for your needs.
- Financial Analysts: Streamline your workflow with a customizable DCF model readily available.
- Consultants: Effortlessly modify the template for impactful client presentations or detailed reports.
- Finance Enthusiasts: Enhance your grasp of valuation methods through practical, real-life examples.
- Educators and Students: Utilize it as an effective resource for hands-on learning in finance-focused courses.
Contents of the Template
- Pre-Filled Data: Features Ipsen S.A.'s historical financial information and projections.
- Discounted Cash Flow Model: Editable DCF valuation model with automated calculations.
- Weighted Average Cost of Capital (WACC): A specific sheet for calculating WACC using custom inputs.
- Key Financial Ratios: Assess Ipsen S.A.'s profitability, efficiency, and leverage metrics.
- Customizable Inputs: Easily modify revenue growth rates, profit margins, and tax rates.
- Clear Dashboard: Visuals and tables summarizing essential valuation outcomes.
Disclaimer
All information, articles, and product details provided on this website are for general informational and educational purposes only. We do not claim any ownership over, nor do we intend to infringe upon, any trademarks, copyrights, logos, brand names, or other intellectual property mentioned or depicted on this site. Such intellectual property remains the property of its respective owners, and any references here are made solely for identification or informational purposes, without implying any affiliation, endorsement, or partnership.
We make no representations or warranties, express or implied, regarding the accuracy, completeness, or suitability of any content or products presented. Nothing on this website should be construed as legal, tax, investment, financial, medical, or other professional advice. In addition, no part of this site—including articles or product references—constitutes a solicitation, recommendation, endorsement, advertisement, or offer to buy or sell any securities, franchises, or other financial instruments, particularly in jurisdictions where such activity would be unlawful.
All content is of a general nature and may not address the specific circumstances of any individual or entity. It is not a substitute for professional advice or services. Any actions you take based on the information provided here are strictly at your own risk. You accept full responsibility for any decisions or outcomes arising from your use of this website and agree to release us from any liability in connection with your use of, or reliance upon, the content or products found herein.