|
Ironwood Pharmaceuticals, Inc. (IRWD) Évaluation DCF |
Entièrement Modifiable: Adapté À Vos Besoins Dans Excel Ou Sheets
Conception Professionnelle: Modèles Fiables Et Conformes Aux Normes Du Secteur
Pré-Construits Pour Une Utilisation Rapide Et Efficace
Compatible MAC/PC, entièrement débloqué
Aucune Expertise N'Est Requise; Facile À Suivre
Ironwood Pharmaceuticals, Inc. (IRWD) Bundle
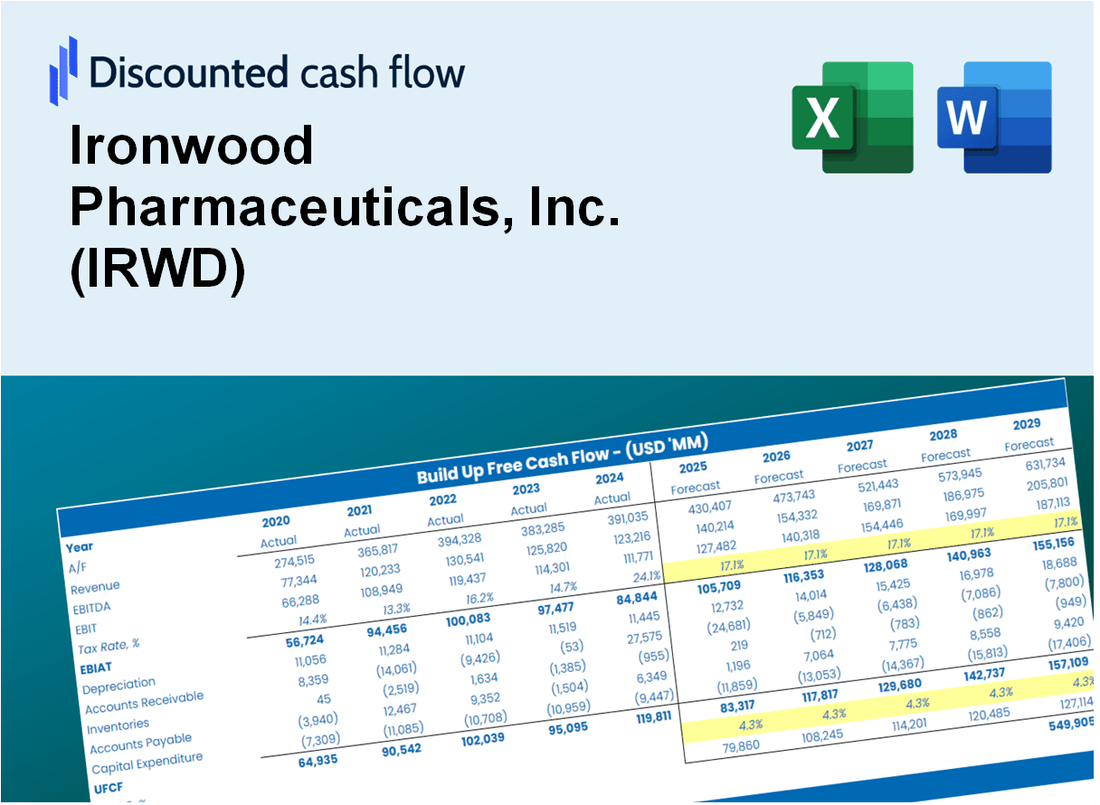
Découvrez le véritable potentiel d'Ironwood Pharmaceuticals, Inc. (IRWD) avec notre calculatrice avancée DCF! Personnalisez les hypothèses clés, explorez divers scénarios et évaluez comment les différents changements affectent l'évaluation Ironwood Pharmaceuticals, Inc. (IRWD) - le tout dans un modèle Excel convivial.
What You Will Get
- Real IRWD Financial Data: Pre-filled with Ironwood Pharmaceuticals’ historical and projected data for precise analysis.
- Fully Editable Template: Modify key inputs like revenue growth, WACC, and EBITDA % with ease.
- Automatic Calculations: See Ironwood Pharmaceuticals’ intrinsic value update instantly based on your changes.
- Professional Valuation Tool: Designed for investors, analysts, and consultants seeking accurate DCF results.
- User-Friendly Design: Simple structure and clear instructions for all experience levels.
Key Features
- Customizable Forecast Inputs: Adjust essential metrics such as revenue growth, EBITDA %, and R&D expenditures.
- Instant DCF Valuation: Automatically computes intrinsic value, NPV, and other key financial indicators.
- High-Precision Accuracy: Leverages Ironwood's actual financial data for dependable valuation results.
- Effortless Scenario Analysis: Easily evaluate various assumptions and analyze different outcomes.
- Efficiency Booster: Streamline your workflow by avoiding the complexity of creating valuation models from the ground up.
How It Works
- Step 1: Download the Excel file.
- Step 2: Review pre-entered Ironwood Pharmaceuticals data (historical and projected).
- Step 3: Adjust key assumptions (yellow cells) based on your analysis.
- Step 4: View automatic recalculations for Ironwood Pharmaceuticals’ intrinsic value.
- Step 5: Use the outputs for investment decisions or reporting.
Why Choose Ironwood Pharmaceuticals, Inc. (IRWD)?
- Innovative Solutions: Cutting-edge therapies tailored to meet patient needs.
- Proven Track Record: Strong clinical results and a commitment to quality.
- Patient-Centric Approach: Focused on enhancing the patient experience and outcomes.
- Expert Team: A dedicated group of professionals driving research and development.
- Industry Recognition: A trusted name in pharmaceuticals with numerous accolades.
Who Should Use This Product?
- Investors: Assess the fair value of Ironwood Pharmaceuticals (IRWD) to inform your investment choices.
- CFOs: Utilize a sophisticated DCF model for accurate financial reporting and analysis.
- Consultants: Easily customize the template for client valuation reports.
- Entrepreneurs: Understand financial modeling techniques employed by leading pharmaceutical companies.
- Educators: Implement it as a resource to teach valuation methods effectively.
What the Template Contains
- Historical Data: Includes Ironwood Pharmaceuticals’ past financials and baseline forecasts.
- DCF and Levered DCF Models: Detailed templates to calculate Ironwood Pharmaceuticals’ intrinsic value.
- WACC Sheet: Pre-built calculations for Weighted Average Cost of Capital.
- Editable Inputs: Modify key drivers like growth rates, EBITDA %, and CAPEX assumptions.
- Quarterly and Annual Statements: A complete breakdown of Ironwood Pharmaceuticals’ financials.
- Interactive Dashboard: Visualize valuation results and projections dynamically.
Disclaimer
All information, articles, and product details provided on this website are for general informational and educational purposes only. We do not claim any ownership over, nor do we intend to infringe upon, any trademarks, copyrights, logos, brand names, or other intellectual property mentioned or depicted on this site. Such intellectual property remains the property of its respective owners, and any references here are made solely for identification or informational purposes, without implying any affiliation, endorsement, or partnership.
We make no representations or warranties, express or implied, regarding the accuracy, completeness, or suitability of any content or products presented. Nothing on this website should be construed as legal, tax, investment, financial, medical, or other professional advice. In addition, no part of this site—including articles or product references—constitutes a solicitation, recommendation, endorsement, advertisement, or offer to buy or sell any securities, franchises, or other financial instruments, particularly in jurisdictions where such activity would be unlawful.
All content is of a general nature and may not address the specific circumstances of any individual or entity. It is not a substitute for professional advice or services. Any actions you take based on the information provided here are strictly at your own risk. You accept full responsibility for any decisions or outcomes arising from your use of this website and agree to release us from any liability in connection with your use of, or reliance upon, the content or products found herein.