
|
ICICI Securities Limited (ISEC.NS) Évaluation DCF |
Entièrement Modifiable: Adapté À Vos Besoins Dans Excel Ou Sheets
Conception Professionnelle: Modèles Fiables Et Conformes Aux Normes Du Secteur
Pré-Construits Pour Une Utilisation Rapide Et Efficace
Compatible MAC/PC, entièrement débloqué
Aucune Expertise N'Est Requise; Facile À Suivre
ICICI Securities Limited (ISEC.NS) Bundle
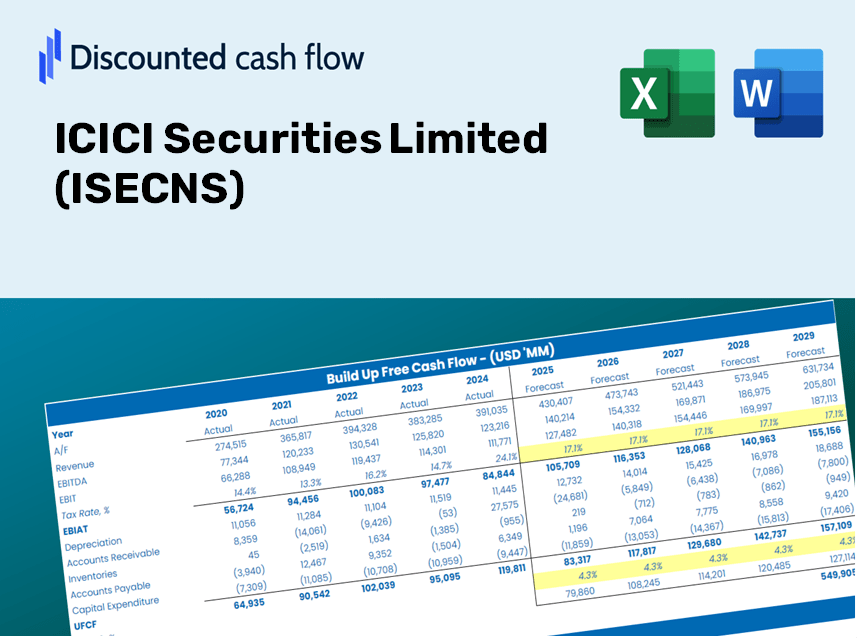
Découvrez la vraie valeur d'ICICI Securities Limited (ISECNS) avec notre calculatrice avancée DCF! Ajustez les hypothèses clés, explorez divers scénarios et évaluez comment les changements affectent l'évaluation ICICI Securities Limited (ISECNS) - le tout dans un modèle d'excel complet.
Discounted Cash Flow (DCF) - (USD MM)
| Year | AY1 2019 |
AY2 2020 |
AY3 2021 |
AY4 2022 |
AY5 2023 |
FY1 2024 |
FY2 2025 |
FY3 2026 |
FY4 2027 |
FY5 2028 |
|---|---|---|---|---|---|---|---|---|---|---|
| Revenue | 16,093.9 | 24,370.3 | 32,169.1 | 33,268.5 | 40,666.8 | 51,756.9 | 65,871.4 | 83,834.9 | 106,697.3 | 135,794.3 |
| Revenue Growth, % | 0 | 51.43 | 32 | 3.42 | 22.24 | 27.27 | 27.27 | 27.27 | 27.27 | 27.27 |
| EBITDA | 9,159.7 | 16,099.6 | 22,036.5 | 21,124.8 | 33,992.1 | 35,046.0 | 44,603.3 | 56,766.9 | 72,247.6 | 91,949.9 |
| EBITDA, % | 56.91 | 66.06 | 68.5 | 63.5 | 83.59 | 67.71 | 67.71 | 67.71 | 67.71 | 67.71 |
| Depreciation | 8,667.6 | 10,303.9 | 12,965.5 | 13,625.7 | 1,089.2 | 18,640.4 | 23,723.7 | 30,193.4 | 38,427.3 | 48,906.7 |
| Depreciation, % | 53.86 | 42.28 | 40.3 | 40.96 | 2.68 | 36.02 | 36.02 | 36.02 | 36.02 | 36.02 |
| EBIT | 492.1 | 5,795.7 | 9,071.0 | 7,499.1 | 32,902.9 | 16,405.6 | 20,879.5 | 26,573.5 | 33,820.3 | 43,043.3 |
| EBIT, % | 3.06 | 23.78 | 28.2 | 22.54 | 80.91 | 31.7 | 31.7 | 31.7 | 31.7 | 31.7 |
| Total Cash | 32,102.2 | 44,089.4 | 59,553.1 | 67,907.7 | 775.1 | 41,602.8 | 52,948.2 | 67,387.5 | 85,764.5 | 109,153.1 |
| Total Cash, percent | .0 | .0 | .0 | .0 | .0 | .0 | .0 | .0 | .0 | .0 |
| Account Receivables | .0 | .0 | .0 | .0 | .0 | .0 | .0 | .0 | .0 | .0 |
| Account Receivables, % | 0 | 0 | 0 | 0 | 0 | 0 | 0 | 0 | 0 | 0 |
| Inventories | 4,995.8 | 28,093.1 | 67,411.7 | -1,535.3 | .0 | 23,438.3 | 29,830.1 | 37,964.9 | 48,318.2 | 61,494.9 |
| Inventories, % | 31.04 | 115.28 | 209.55 | -4.61 | 0 | 45.29 | 45.29 | 45.29 | 45.29 | 45.29 |
| Accounts Payable | 6,926.4 | 10,264.6 | 10,776.1 | 9,148.4 | 23,883.6 | 21,208.3 | 26,991.9 | 34,352.8 | 43,721.1 | 55,644.1 |
| Accounts Payable, % | 43.04 | 42.12 | 33.5 | 27.5 | 58.73 | 40.98 | 40.98 | 40.98 | 40.98 | 40.98 |
| Capital Expenditure | -233.9 | -407.0 | -641.0 | -1,257.7 | -2,587.2 | -1,579.5 | -2,010.2 | -2,558.4 | -3,256.1 | -4,144.0 |
| Capital Expenditure, % | -1.45 | -1.67 | -1.99 | -3.78 | -6.36 | -3.05 | -3.05 | -3.05 | -3.05 | -3.05 |
| Tax Rate, % | 25.5 | 25.5 | 25.5 | 25.5 | 25.5 | 25.5 | 25.5 | 25.5 | 25.5 | 25.5 |
| EBITAT | 354.2 | 4,325.0 | 6,769.1 | 5,583.3 | 24,511.8 | 12,146.2 | 15,458.5 | 19,674.2 | 25,039.5 | 31,867.9 |
| Depreciation | ||||||||||
| Changes in Account Receivables | ||||||||||
| Changes in Inventories | ||||||||||
| Changes in Accounts Payable | ||||||||||
| Capital Expenditure | ||||||||||
| UFCF | 10,718.5 | -5,537.2 | -19,713.5 | 85,270.6 | 36,213.7 | 3,093.5 | 36,564.0 | 46,535.2 | 59,225.7 | 75,376.9 |
| WACC, % | 6.46 | 6.52 | 6.52 | 6.52 | 6.52 | 6.51 | 6.51 | 6.51 | 6.51 | 6.51 |
| PV UFCF | ||||||||||
| SUM PV UFCF | 174,661.1 | |||||||||
| Long Term Growth Rate, % | 2.00 | |||||||||
| Free cash flow (T + 1) | 76,884 | |||||||||
| Terminal Value | 1,704,874 | |||||||||
| Present Terminal Value | 1,243,789 | |||||||||
| Enterprise Value | 1,418,450 | |||||||||
| Net Debt | 167,984 | |||||||||
| Equity Value | 1,250,466 | |||||||||
| Diluted Shares Outstanding, MM | 325 | |||||||||
| Equity Value Per Share | 3,848.77 |
What You Will Receive
- Genuine ICICI Data: Preloaded financial metrics – covering everything from revenue to EBIT – based on actual and forecasted figures.
- Complete Customization: Modify all vital parameters (yellow cells) such as WACC, growth %, and tax rates to suit your analysis.
- Immediate Valuation Updates: Automatic recalculations to assess how changes affect the fair value of ICICI Securities Limited (ISECNS).
- Flexible Excel Template: Designed for quick modifications, scenario analysis, and in-depth projections.
- Efficient and Accurate: Eliminate the hassle of building models from the ground up while ensuring precision and adaptability.
Key Features
- Genuine Financial Insights: Gain access to reliable, pre-loaded historical data and future forecasts for ICICI Securities Limited (ISECNS).
- Tailored Forecast Assumptions: Modify the highlighted cells, including WACC, growth rates, and margins, to suit your analysis.
- Real-Time Calculations: Automatic adjustments for DCF, Net Present Value (NPV), and cash flow assessments.
- Interactive Dashboard: User-friendly charts and summaries to clearly present your valuation findings.
- Suitable for All Levels: An intuitive layout designed for investors, CFOs, and consultants, whether you're a novice or an expert.
How It Functions
- Step 1: Download the Excel spreadsheet.
- Step 2: Examine the pre-filled ICICI Securities Limited (ISECNS) data (both historical and forecasted).
- Step 3: Modify key assumptions (highlighted in yellow) according to your analysis.
- Step 4: Observe automatic updates reflecting ICICI Securities Limited (ISECNS) intrinsic value.
- Step 5: Utilize the results for your investment strategies or reporting needs.
Why Select This Calculator from ICICI Securities Limited (ISECNS)?
- All-in-One Solution: Offers DCF, WACC, and financial ratio analyses bundled together.
- Flexible Inputs: Modify the yellow-highlighted fields to explore different scenarios.
- Thorough Analysis: Automatically computes the intrinsic value and Net Present Value for your assessments.
- Preloaded Information: Access to historical and projected data provides reliable starting points.
- High-Quality Standards: Perfect for financial analysts, investors, and business consultants alike.
Who Should Use ICICI Securities Limited (ISECNS)?
- Finance Students: Explore valuation methodologies and practice with actual market data.
- Academics: Integrate established financial models into your curriculum or research projects.
- Investors: Challenge your predictions and evaluate valuation results for ICICI Securities Limited (ISECNS) shares.
- Analysts: Enhance your efficiency with a ready-made, adaptable DCF model tailored for your needs.
- Small Business Owners: Learn how major public firms like ICICI Securities Limited (ISECNS) are evaluated in the market.
Contents of the Template
- Historical Data: Contains ICICI Securities Limited's past financial records and baseline forecasts.
- DCF and Levered DCF Models: Comprehensive templates to evaluate the intrinsic value of ICICI Securities Limited (ISECNS).
- WACC Sheet: Pre-configured calculations for the Weighted Average Cost of Capital.
- Editable Inputs: Customize key parameters such as growth rates, EBITDA %, and CAPEX projections.
- Quarterly and Annual Statements: An exhaustive breakdown of ICICI Securities Limited's financial performance.
- Interactive Dashboard: Dynamically visualize valuation outcomes and forecasts.
Disclaimer
All information, articles, and product details provided on this website are for general informational and educational purposes only. We do not claim any ownership over, nor do we intend to infringe upon, any trademarks, copyrights, logos, brand names, or other intellectual property mentioned or depicted on this site. Such intellectual property remains the property of its respective owners, and any references here are made solely for identification or informational purposes, without implying any affiliation, endorsement, or partnership.
We make no representations or warranties, express or implied, regarding the accuracy, completeness, or suitability of any content or products presented. Nothing on this website should be construed as legal, tax, investment, financial, medical, or other professional advice. In addition, no part of this site—including articles or product references—constitutes a solicitation, recommendation, endorsement, advertisement, or offer to buy or sell any securities, franchises, or other financial instruments, particularly in jurisdictions where such activity would be unlawful.
All content is of a general nature and may not address the specific circumstances of any individual or entity. It is not a substitute for professional advice or services. Any actions you take based on the information provided here are strictly at your own risk. You accept full responsibility for any decisions or outcomes arising from your use of this website and agree to release us from any liability in connection with your use of, or reliance upon, the content or products found herein.