
|
ITI LIMITED (ITI.NS) Évaluation DCF |
Entièrement Modifiable: Adapté À Vos Besoins Dans Excel Ou Sheets
Conception Professionnelle: Modèles Fiables Et Conformes Aux Normes Du Secteur
Pré-Construits Pour Une Utilisation Rapide Et Efficace
Compatible MAC/PC, entièrement débloqué
Aucune Expertise N'Est Requise; Facile À Suivre
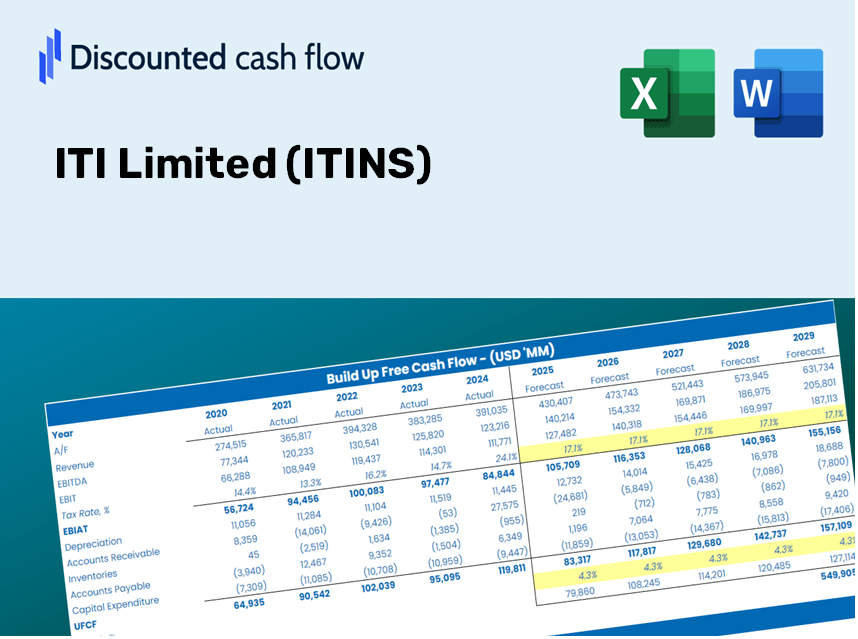
ITI Limited (ITI.NS) Bundle
Explorez le potentiel financier d'ITI Limited (ITIN) avec notre calculatrice DCF conviviale! Entrez vos projections pour la croissance, les marges et les dépenses pour calculer la valeur intrinsèque d'ITI Limited (ITIN) et façonner votre approche d'investissement.
Discounted Cash Flow (DCF) - (USD MM)
| Year | AY1 2021 |
AY2 2022 |
AY3 2023 |
AY4 2024 |
AY5 2025 |
FY1 2026 |
FY2 2027 |
FY3 2028 |
FY4 2029 |
FY5 2030 |
|---|---|---|---|---|---|---|---|---|---|---|
| Revenue | 23,621.8 | 18,607.3 | 13,954.3 | 12,636.3 | 36,164.2 | 40,171.2 | 44,622.2 | 49,566.4 | 55,058.5 | 61,159.0 |
| Revenue Growth, % | 0 | -21.23 | -25.01 | -9.44 | 186.19 | 11.08 | 11.08 | 11.08 | 11.08 | 11.08 |
| EBITDA | 2,126.4 | 3,632.8 | -1,013.1 | -3,103.5 | 786.1 | -90.1 | -100.1 | -111.1 | -123.5 | -137.1 |
| EBITDA, % | 9 | 19.52 | -7.26 | -24.56 | 2.17 | -0.22423 | -0.22423 | -0.22423 | -0.22423 | -0.22423 |
| Depreciation | 418.5 | 510.1 | 495.0 | 531.2 | 692.0 | 1,139.1 | 1,265.3 | 1,405.5 | 1,561.2 | 1,734.2 |
| Depreciation, % | 1.77 | 2.74 | 3.55 | 4.2 | 1.91 | 2.84 | 2.84 | 2.84 | 2.84 | 2.84 |
| EBIT | 1,707.9 | 3,122.7 | -1,508.1 | -3,634.7 | 94.1 | -1,229.2 | -1,365.4 | -1,516.6 | -1,684.7 | -1,871.3 |
| EBIT, % | 7.23 | 16.78 | -10.81 | -28.76 | 0.2602 | -3.06 | -3.06 | -3.06 | -3.06 | -3.06 |
| Total Cash | 4,342.7 | 968.5 | 2,148.4 | 6,524.6 | 23,549.0 | 12,512.2 | 13,898.5 | 15,438.5 | 17,149.1 | 19,049.3 |
| Total Cash, percent | .0 | .0 | .0 | .0 | .0 | .0 | .0 | .0 | .0 | .0 |
| Account Receivables | 49,042.7 | 59,162.3 | 50,078.3 | 53,832.7 | 44,538.3 | 40,171.2 | 44,622.2 | 49,566.4 | 55,058.5 | 61,159.0 |
| Account Receivables, % | 207.62 | 317.95 | 358.87 | 426.02 | 123.16 | 100 | 100 | 100 | 100 | 100 |
| Inventories | 1,873.0 | 1,934.0 | 2,497.5 | 2,222.0 | 2,313.9 | 4,836.9 | 5,372.8 | 5,968.1 | 6,629.4 | 7,363.9 |
| Inventories, % | 7.93 | 10.39 | 17.9 | 17.58 | 6.4 | 12.04 | 12.04 | 12.04 | 12.04 | 12.04 |
| Accounts Payable | 18,854.3 | 16,900.6 | 13,766.8 | 15,574.6 | 32,702.5 | 36,935.8 | 41,028.4 | 45,574.4 | 50,624.0 | 56,233.2 |
| Accounts Payable, % | 79.82 | 90.83 | 98.66 | 123.25 | 90.43 | 91.95 | 91.95 | 91.95 | 91.95 | 91.95 |
| Capital Expenditure | -314.1 | -601.6 | -607.0 | -375.7 | -158.7 | -990.2 | -1,099.9 | -1,221.8 | -1,357.1 | -1,507.5 |
| Capital Expenditure, % | -1.33 | -3.23 | -4.35 | -2.97 | -0.43883 | -2.46 | -2.46 | -2.46 | -2.46 | -2.46 |
| Tax Rate, % | 0 | 0 | 0 | 0 | 0 | 0 | 0 | 0 | 0 | 0 |
| EBITAT | 1,707.9 | 3,097.0 | -1,508.1 | -3,633.8 | 94.1 | -1,227.1 | -1,363.0 | -1,514.1 | -1,681.8 | -1,868.2 |
| Depreciation | ||||||||||
| Changes in Account Receivables | ||||||||||
| Changes in Inventories | ||||||||||
| Changes in Accounts Payable | ||||||||||
| Capital Expenditure | ||||||||||
| UFCF | -30,249.0 | -9,128.8 | 3,766.5 | -5,149.4 | 26,957.8 | 4,999.3 | -2,092.1 | -2,323.9 | -2,581.3 | -2,867.4 |
| WACC, % | 5.13 | 5.13 | 5.13 | 5.13 | 5.13 | 5.13 | 5.13 | 5.13 | 5.13 | 5.13 |
| PV UFCF | ||||||||||
| SUM PV UFCF | -3,483.4 | |||||||||
| Long Term Growth Rate, % | 2.00 | |||||||||
| Free cash flow (T + 1) | -2,925 | |||||||||
| Terminal Value | -93,424 | |||||||||
| Present Terminal Value | -72,747 | |||||||||
| Enterprise Value | -76,230 | |||||||||
| Net Debt | 13,321 | |||||||||
| Equity Value | -89,552 | |||||||||
| Diluted Shares Outstanding, MM | 959 | |||||||||
| Equity Value Per Share | -93.35 |
What You Can Expect
- Authentic ITINS Financial Data: Pre-filled with ITI Limited’s historical and projected data for precise analysis.
- Completely Customizable Template: Easily adjust key parameters such as revenue growth, WACC, and EBITDA percentage.
- Instant Calculations: Watch ITI Limited’s intrinsic value refresh instantly based on your modifications.
- Professional Valuation Tool: Tailored for investors, analysts, and consultants in need of accurate DCF outcomes.
- Intuitive User Interface: Organized layout and straightforward instructions suitable for all experience levels.
Key Features
- 🔍 Real-Life ITINS Financials: Pre-filled historical and projected data for ITI Limited.
- ✏️ Fully Customizable Inputs: Modify all essential parameters (yellow cells) such as WACC, growth %, and tax rates.
- 📊 Professional DCF Valuation: Integrated formulas assess ITI Limited’s intrinsic value using the Discounted Cash Flow method.
- ⚡ Instant Results: View ITI Limited’s valuation in real-time after adjusting inputs.
- Scenario Analysis: Evaluate and contrast outcomes for different financial assumptions side-by-side.
How It Functions
- Download: Get the pre-prepared Excel file containing ITI Limited's (ITINS) financial data.
- Customize: Modify forecasts, such as revenue growth, EBITDA %, and WACC.
- Update Automatically: The intrinsic value and NPV calculations refresh in real-time.
- Test Scenarios: Develop various projections and instantly compare results.
- Make Decisions: Utilize the valuation findings to inform your investment approach.
Why Opt for This Calculator?
- Precision: Utilizes actual ITI Limited (ITINS) financials to ensure high data reliability.
- Adaptability: Crafted for users to easily modify and experiment with their inputs.
- Efficiency: Eliminate the complexity of constructing a DCF model from the ground up.
- Enterprise-Level Quality: Designed with the accuracy and usability expected at the CFO level.
- Accessible: Intuitive interface, suitable even for those without extensive financial modeling expertise.
Who Can Benefit from This Product?
- Individual Investors: Make well-informed choices regarding the purchase or sale of ITI Limited (ITINS) stock.
- Financial Analysts: Enhance valuation workflows with easily accessible financial models.
- Consultants: Provide clients with expert valuation insights swiftly and precisely.
- Business Owners: Gain insights into how major companies like ITI Limited (ITINS) are valued to inform your own business strategies.
- Finance Students: Acquire valuation skills through the analysis of real-world data and scenarios.
Contents of the Template
- Pre-Filled Data: Features historical financials and projections for ITI Limited (ITINS).
- Discounted Cash Flow Model: An editable DCF valuation model with automated calculations.
- Weighted Average Cost of Capital (WACC): A specialized sheet for calculating WACC using tailored inputs.
- Key Financial Ratios: Assess ITI Limited’s profitability, efficiency, and leverage metrics.
- Customizable Inputs: Easily adjust revenue growth, margins, and tax rates.
- Clear Dashboard: Visualizations and tables that succinctly summarize key valuation findings.
Disclaimer
All information, articles, and product details provided on this website are for general informational and educational purposes only. We do not claim any ownership over, nor do we intend to infringe upon, any trademarks, copyrights, logos, brand names, or other intellectual property mentioned or depicted on this site. Such intellectual property remains the property of its respective owners, and any references here are made solely for identification or informational purposes, without implying any affiliation, endorsement, or partnership.
We make no representations or warranties, express or implied, regarding the accuracy, completeness, or suitability of any content or products presented. Nothing on this website should be construed as legal, tax, investment, financial, medical, or other professional advice. In addition, no part of this site—including articles or product references—constitutes a solicitation, recommendation, endorsement, advertisement, or offer to buy or sell any securities, franchises, or other financial instruments, particularly in jurisdictions where such activity would be unlawful.
All content is of a general nature and may not address the specific circumstances of any individual or entity. It is not a substitute for professional advice or services. Any actions you take based on the information provided here are strictly at your own risk. You accept full responsibility for any decisions or outcomes arising from your use of this website and agree to release us from any liability in connection with your use of, or reliance upon, the content or products found herein.