
|
Le Jammu-et-Cachemire Bank Limited (J & Kbank.NS) DCF Valation |
Entièrement Modifiable: Adapté À Vos Besoins Dans Excel Ou Sheets
Conception Professionnelle: Modèles Fiables Et Conformes Aux Normes Du Secteur
Pré-Construits Pour Une Utilisation Rapide Et Efficace
Compatible MAC/PC, entièrement débloqué
Aucune Expertise N'Est Requise; Facile À Suivre
The Jammu and Kashmir Bank Limited (J&KBANK.NS) Bundle
Simplifiez l'évaluation de l'évaluation du Jammu-et-Cachemire Bank Limited (J & Kbankns) avec cette calculatrice DCF personnalisable! Avec Real The Jammu et Cachemir Bank Limited (J & Kbankns) Financials and Adjustable Forecast Intarts, vous pouvez tester des scénarios et découvrir la juste valeur du Jammu-and-Cachemir Bank Limited (J & Kbankns).
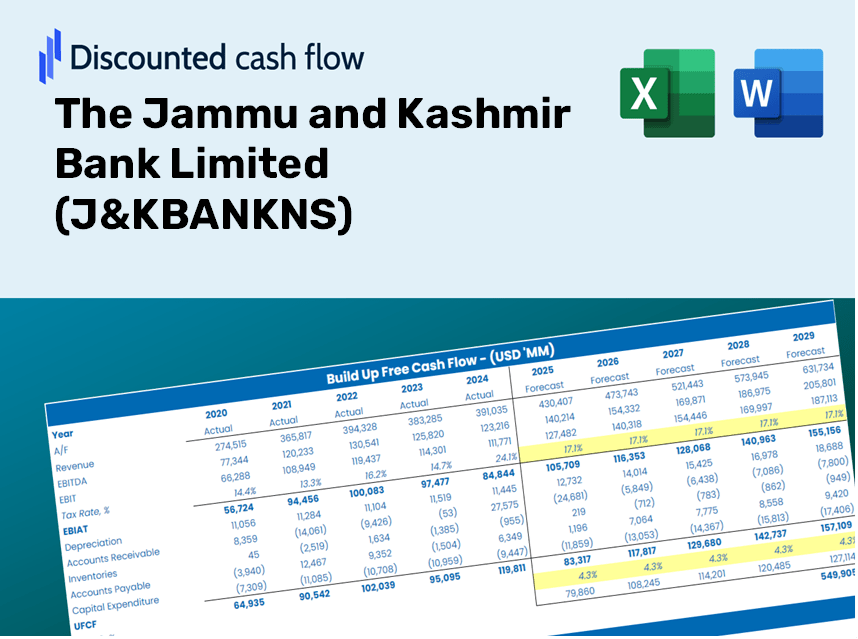
Discounted Cash Flow (DCF) - (USD MM)
| Year | AY1 2020 |
AY2 2021 |
AY3 2022 |
AY4 2023 |
AY5 2024 |
FY1 2025 |
FY2 2026 |
FY3 2027 |
FY4 2028 |
FY5 2029 |
|---|---|---|---|---|---|---|---|---|---|---|
| Revenue | 13,567.0 | 14,092.6 | 9,783.1 | 10,851.4 | 11,500.9 | 11,219.2 | 10,944.3 | 10,676.2 | 10,414.6 | 10,159.5 |
| Revenue Growth, % | 0 | 3.87 | -30.58 | 10.92 | 5.99 | -2.45 | -2.45 | -2.45 | -2.45 | -2.45 |
| EBITDA | 685.0 | 1,019.1 | 878.7 | 996.3 | 1,255.1 | 928.0 | 905.3 | 883.1 | 861.4 | 840.3 |
| EBITDA, % | 5.05 | 7.23 | 8.98 | 9.18 | 10.91 | 8.27 | 8.27 | 8.27 | 8.27 | 8.27 |
| Depreciation | 181.6 | 250.8 | 301.1 | 307.3 | 308.7 | 262.8 | 256.4 | 250.1 | 243.9 | 238.0 |
| Depreciation, % | 1.34 | 1.78 | 3.08 | 2.83 | 2.68 | 2.34 | 2.34 | 2.34 | 2.34 | 2.34 |
| EBIT | 503.4 | 768.3 | 577.7 | 689.1 | 946.3 | 665.2 | 648.9 | 633.0 | 617.5 | 602.4 |
| EBIT, % | 3.71 | 5.45 | 5.9 | 6.35 | 8.23 | 5.93 | 5.93 | 5.93 | 5.93 | 5.93 |
| Total Cash | 1,209.9 | 1,014.2 | 1,140.5 | 770.9 | 1,894.3 | 1,152.1 | 1,123.9 | 1,096.4 | 1,069.5 | 1,043.3 |
| Total Cash, percent | .0 | .0 | .0 | .0 | .0 | .0 | .0 | .0 | .0 | .0 |
| Account Receivables | 3,167.3 | 3,101.4 | 3,405.4 | 2,430.9 | 2,845.5 | 2,856.5 | 2,786.5 | 2,718.3 | 2,651.7 | 2,586.7 |
| Account Receivables, % | 23.35 | 22.01 | 34.81 | 22.4 | 24.74 | 25.46 | 25.46 | 25.46 | 25.46 | 25.46 |
| Inventories | .0 | .0 | .0 | .0 | .0 | .0 | .0 | .0 | .0 | .0 |
| Inventories, % | 0 | 0 | 0 | 0 | 0 | 0 | 0 | 0 | 0 | 0 |
| Accounts Payable | 1,061.8 | 908.4 | 966.8 | 922.4 | 1,029.1 | 933.5 | 910.6 | 888.3 | 866.6 | 845.3 |
| Accounts Payable, % | 7.83 | 6.45 | 9.88 | 8.5 | 8.95 | 8.32 | 8.32 | 8.32 | 8.32 | 8.32 |
| Capital Expenditure | -118.3 | -92.8 | -127.6 | -137.5 | -121.1 | -115.7 | -112.8 | -110.1 | -107.4 | -104.7 |
| Capital Expenditure, % | -0.87174 | -0.6586 | -1.3 | -1.27 | -1.05 | -1.03 | -1.03 | -1.03 | -1.03 | -1.03 |
| Tax Rate, % | -3.71 | -3.71 | -3.71 | -3.71 | -3.71 | -3.71 | -3.71 | -3.71 | -3.71 | -3.71 |
| EBITAT | 561.2 | 526.9 | 779.2 | 880.6 | 981.4 | 623.4 | 608.1 | 593.2 | 578.7 | 564.5 |
| Depreciation | ||||||||||
| Changes in Account Receivables | ||||||||||
| Changes in Inventories | ||||||||||
| Changes in Accounts Payable | ||||||||||
| Capital Expenditure | ||||||||||
| UFCF | -1,481.0 | 597.5 | 707.0 | 1,980.3 | 861.3 | 663.8 | 798.8 | 779.2 | 760.1 | 741.5 |
| WACC, % | 7.25 | 7.01 | 7.25 | 7.25 | 7.25 | 7.2 | 7.2 | 7.2 | 7.2 | 7.2 |
| PV UFCF | ||||||||||
| SUM PV UFCF | 3,045.9 | |||||||||
| Long Term Growth Rate, % | 2.00 | |||||||||
| Free cash flow (T + 1) | 756 | |||||||||
| Terminal Value | 14,537 | |||||||||
| Present Terminal Value | 10,267 | |||||||||
| Enterprise Value | 13,313 | |||||||||
| Net Debt | 1,607 | |||||||||
| Equity Value | 11,705 | |||||||||
| Diluted Shares Outstanding, MM | 126 | |||||||||
| Equity Value Per Share | 92.99 |
Benefits You Will Receive
- Customizable Excel Template: A fully adjustable Excel-based DCF Calculator featuring pre-filled real financial data for J&K Bank (J&KBANKNS).
- Real-Time Data: Access to historical data and forward-looking projections (highlighted in the yellow cells).
- Assumption Flexibility: Adjust forecast assumptions such as revenue growth, EBITDA margin, and WACC.
- Instant Calculations: Quickly view how your inputs affect the valuation of J&K Bank (J&KBANKNS).
- Professional Resource: Designed for investors, CFOs, consultants, and financial analysts.
- Easy-to-Use Interface: Organized for clarity and simplicity, complete with step-by-step guidance.
Key Features
- 🔍 Real-Life J&K Bank Financials: Pre-filled historical and projected data for The Jammu and Kashmir Bank Limited (J&KBANKNS).
- ✏️ Fully Customizable Inputs: Modify all essential parameters (yellow cells) such as WACC, growth %, and tax rates.
- 📊 Professional DCF Valuation: Integrated formulas provide an intrinsic value calculation for J&K Bank using the Discounted Cash Flow method.
- ⚡ Instant Results: Visualize J&K Bank's valuation immediately after making any adjustments.
- Scenario Analysis: Evaluate and compare outcomes for different financial assumptions side-by-side.
How It Works
- Step 1: Download the prebuilt Excel template that includes data for The Jammu and Kashmir Bank Limited (J&KBANKNS).
- Step 2: Navigate through the pre-filled sheets to familiarize yourself with the essential metrics.
- Step 3: Modify your forecasts and assumptions in the editable yellow cells (WACC, growth, margins).
- Step 4: Instantly observe the recalculated results, including the intrinsic value for The Jammu and Kashmir Bank Limited (J&KBANKNS).
- Step 5: Utilize the outputs to make informed investment decisions or to create detailed reports.
Why Opt for J&K Bank's Financial Calculator?
- Precision: Trustworthy data based on real J&K Bank financials ensures high accuracy.
- Adaptability: Crafted for users to easily test and modify inputs as needed.
- Efficiency: Eliminate the complexity of constructing a DCF model from the ground up.
- Expert-Level: Engineered with the accuracy and user-friendliness expected at the CFO level.
- Intuitive: Simple to navigate, catering to users with varying levels of financial modeling experience.
Who Can Benefit from Our Services?
- Finance Students: Master valuation techniques while working with authentic data relevant to J&K Bank (J&KBANKNS).
- Researchers: Integrate industry-standard models into your academic projects and studies.
- Investors: Evaluate and refine your investment strategies by analyzing valuation metrics for J&K Bank (J&KBANKNS).
- Financial Analysts: Enhance your efficiency with our customizable DCF model designed specifically for J&K Bank (J&KBANKNS).
- Small Business Owners: Understand the analytical techniques used to evaluate major institutions like J&K Bank (J&KBANKNS).
Contents of the Template
- Pre-Filled Data: Features historical financial information and forecasts for The Jammu and Kashmir Bank Limited (J&KBANKNS).
- Discounted Cash Flow Model: An editable DCF valuation model with automatic calculations included.
- Weighted Average Cost of Capital (WACC): A dedicated sheet to calculate WACC based on your customized inputs.
- Key Financial Ratios: Assess profitability, efficiency, and leverage metrics for The Jammu and Kashmir Bank Limited (J&KBANKNS).
- Customizable Inputs: Easily modify revenue growth, margins, and tax rates as needed.
- Clear Dashboard: Visual representations and tables that summarize essential valuation outcomes.
Disclaimer
All information, articles, and product details provided on this website are for general informational and educational purposes only. We do not claim any ownership over, nor do we intend to infringe upon, any trademarks, copyrights, logos, brand names, or other intellectual property mentioned or depicted on this site. Such intellectual property remains the property of its respective owners, and any references here are made solely for identification or informational purposes, without implying any affiliation, endorsement, or partnership.
We make no representations or warranties, express or implied, regarding the accuracy, completeness, or suitability of any content or products presented. Nothing on this website should be construed as legal, tax, investment, financial, medical, or other professional advice. In addition, no part of this site—including articles or product references—constitutes a solicitation, recommendation, endorsement, advertisement, or offer to buy or sell any securities, franchises, or other financial instruments, particularly in jurisdictions where such activity would be unlawful.
All content is of a general nature and may not address the specific circumstances of any individual or entity. It is not a substitute for professional advice or services. Any actions you take based on the information provided here are strictly at your own risk. You accept full responsibility for any decisions or outcomes arising from your use of this website and agree to release us from any liability in connection with your use of, or reliance upon, the content or products found herein.