
|
J. B. produits chimiques & Pharmaceuticals Limited (JBChepharm.NS) Évaluation DCF |
Entièrement Modifiable: Adapté À Vos Besoins Dans Excel Ou Sheets
Conception Professionnelle: Modèles Fiables Et Conformes Aux Normes Du Secteur
Pré-Construits Pour Une Utilisation Rapide Et Efficace
Compatible MAC/PC, entièrement débloqué
Aucune Expertise N'Est Requise; Facile À Suivre
J. B. Chemicals & Pharmaceuticals Limited (JBCHEPHARM.NS) Bundle
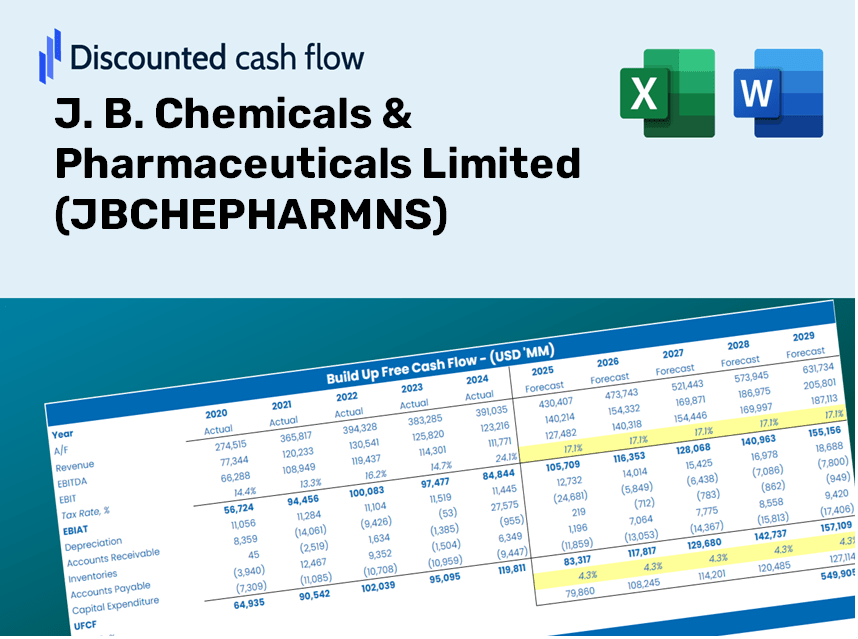
Gardez un aperçu de vos produits chimiques J. B. & Analyse d'évaluation pharmaceuticals Limited (JBChepharmns) utilisant notre calculatrice sophistiquée DCF! Ce modèle Excel est préchargé avec des données réelles (jbchepharmns), vous permettant d'ajuster les prévisions et les hypothèses pour déterminer avec précision la valeur intrinsèque de J. B. Chemicals & Pharmaceuticals Limited.
Discounted Cash Flow (DCF) - (USD MM)
| Year | AY1 2021 |
AY2 2022 |
AY3 2023 |
AY4 2024 |
AY5 2025 |
FY1 2026 |
FY2 2027 |
FY3 2028 |
FY4 2029 |
FY5 2030 |
|---|---|---|---|---|---|---|---|---|---|---|
| Revenue | 20,058.5 | 24,242.4 | 31,165.1 | 34,841.8 | 39,179.9 | 46,395.2 | 54,939.2 | 65,056.7 | 77,037.4 | 91,224.4 |
| Revenue Growth, % | 0 | 20.86 | 28.56 | 11.8 | 12.45 | 18.42 | 18.42 | 18.42 | 18.42 | 18.42 |
| EBITDA | 6,722.6 | 5,815.3 | 7,043.7 | 9,334.8 | 10,318.4 | 12,362.7 | 14,639.3 | 17,335.3 | 20,527.7 | 24,308.1 |
| EBITDA, % | 33.51 | 23.99 | 22.6 | 26.79 | 26.34 | 26.65 | 26.65 | 26.65 | 26.65 | 26.65 |
| Depreciation | 686.7 | 726.6 | 1,144.1 | 1,383.2 | 1,710.4 | 1,709.8 | 2,024.7 | 2,397.6 | 2,839.1 | 3,362.0 |
| Depreciation, % | 3.42 | 3 | 3.67 | 3.97 | 4.37 | 3.69 | 3.69 | 3.69 | 3.69 | 3.69 |
| EBIT | 6,035.9 | 5,088.7 | 5,899.6 | 7,951.6 | 8,608.0 | 10,652.8 | 12,614.6 | 14,937.7 | 17,688.6 | 20,946.1 |
| EBIT, % | 30.09 | 20.99 | 18.93 | 22.82 | 21.97 | 22.96 | 22.96 | 22.96 | 22.96 | 22.96 |
| Total Cash | 6,936.6 | 566.5 | 2,692.0 | 4,596.4 | 4,500.9 | 6,517.3 | 7,717.5 | 9,138.7 | 10,821.7 | 12,814.6 |
| Total Cash, percent | .0 | .0 | .0 | .0 | .0 | .0 | .0 | .0 | .0 | .0 |
| Account Receivables | 3,890.2 | 5,981.2 | 6,066.4 | 7,042.8 | 9,015.5 | 9,906.0 | 11,730.2 | 13,890.4 | 16,448.5 | 19,477.6 |
| Account Receivables, % | 19.39 | 24.67 | 19.47 | 20.21 | 23.01 | 21.35 | 21.35 | 21.35 | 21.35 | 21.35 |
| Inventories | 3,474.5 | 4,099.6 | 4,304.9 | 5,025.1 | 5,289.5 | 7,049.2 | 8,347.4 | 9,884.6 | 11,704.9 | 13,860.5 |
| Inventories, % | 17.32 | 16.91 | 13.81 | 14.42 | 13.5 | 15.19 | 15.19 | 15.19 | 15.19 | 15.19 |
| Accounts Payable | 1,869.2 | 2,244.8 | 2,386.5 | 3,563.1 | 4,107.2 | 4,356.1 | 5,158.3 | 6,108.3 | 7,233.1 | 8,565.2 |
| Accounts Payable, % | 9.32 | 9.26 | 7.66 | 10.23 | 10.48 | 9.39 | 9.39 | 9.39 | 9.39 | 9.39 |
| Capital Expenditure | -477.7 | -7,067.9 | -7,649.5 | -2,613.7 | -975.9 | -6,131.0 | -7,260.1 | -8,597.1 | -10,180.4 | -12,055.2 |
| Capital Expenditure, % | -2.38 | -29.16 | -24.55 | -7.5 | -2.49 | -13.21 | -13.21 | -13.21 | -13.21 | -13.21 |
| Tax Rate, % | 25.67 | 25.67 | 25.67 | 25.67 | 25.67 | 25.67 | 25.67 | 25.67 | 25.67 | 25.67 |
| EBITAT | 4,530.0 | 3,883.9 | 4,354.7 | 5,847.3 | 6,398.2 | 7,948.1 | 9,411.8 | 11,145.1 | 13,197.5 | 15,627.9 |
| Depreciation | ||||||||||
| Changes in Account Receivables | ||||||||||
| Changes in Inventories | ||||||||||
| Changes in Accounts Payable | ||||||||||
| Capital Expenditure | ||||||||||
| UFCF | -756.5 | -4,797.9 | -2,299.6 | 4,096.8 | 5,439.6 | 1,125.7 | 1,856.2 | 2,198.0 | 2,602.8 | 3,082.1 |
| WACC, % | 4.56 | 4.56 | 4.56 | 4.56 | 4.56 | 4.56 | 4.56 | 4.56 | 4.56 | 4.56 |
| PV UFCF | ||||||||||
| SUM PV UFCF | 9,340.4 | |||||||||
| Long Term Growth Rate, % | 4.00 | |||||||||
| Free cash flow (T + 1) | 3,205 | |||||||||
| Terminal Value | 570,526 | |||||||||
| Present Terminal Value | 456,467 | |||||||||
| Enterprise Value | 465,808 | |||||||||
| Net Debt | -1,016 | |||||||||
| Equity Value | 466,823 | |||||||||
| Diluted Shares Outstanding, MM | 159 | |||||||||
| Equity Value Per Share | 2,941.45 |
What You Will Receive
- Authentic JBCHEPHARMNS Financial Data: Pre-loaded with historical and forecasted data for accurate analysis.
- Fully Customizable Template: Easily adjust essential inputs such as revenue growth, WACC, and EBITDA percentage.
- Instant Calculations: Watch JBCHEPHARMNS's intrinsic value update in real-time as you make modifications.
- Professional Valuation Tool: Tailored for investors, analysts, and consultants aiming for precise DCF outputs.
- User-Friendly Interface: Streamlined layout and straightforward instructions suitable for all experience levels.
Key Features
- Authentic Financial Data for JBCHEPHARMNS: Gain access to reliable pre-loaded historical performance metrics and future forecasts.
- Adjustable Forecast Parameters: Customize key assumptions in highlighted cells, including WACC, growth rates, and profit margins.
- Real-Time Calculations: Automatic updates for DCF, Net Present Value (NPV), and cash flow analyses.
- User-Friendly Dashboard: Intuitive charts and summaries designed to illustrate your valuation outcomes clearly.
- Suitable for All Experience Levels: A straightforward, user-centric layout tailored for investors, CFOs, and consultants alike.
How It Functions
- Download the Template: Obtain immediate access to the Excel-based JBCHEPHARMNS DCF Calculator.
- Enter Your Assumptions: Modify the yellow-highlighted cells for growth rates, WACC, margins, and additional parameters.
- Automatic Calculations: The model will automatically refresh to show J. B. Chemicals & Pharmaceuticals Limited's intrinsic value.
- Evaluate Scenarios: Test various assumptions to assess potential changes in valuation.
- Analyze and Make Decisions: Utilize the outcomes to inform your investment or financial strategy.
Why Opt for JBCHEPHARMNS Calculator?
- Precision: Utilizes authentic J. B. Chemicals & Pharmaceuticals Limited financial data for reliable results.
- Customizable: Built to empower users to adjust and experiment with their inputs effortlessly.
- Efficiency: Eliminate the complexities of constructing a DCF model from the ground up.
- Expert-Quality: Crafted with the expertise and functionality expected by CFOs.
- Intuitive Interface: Simple to navigate, making it accessible for individuals without extensive financial modeling skills.
Who Should Consider This Product?
- Investors: Assess J. B. Chemicals & Pharmaceuticals Limited's (JBCHEPHARMNS) valuation prior to making stock decisions.
- CFOs and Financial Analysts: Enhance valuation workflows and evaluate financial forecasts.
- Startup Founders: Discover the valuation methodologies used for leading firms such as J. B. Chemicals & Pharmaceuticals Limited.
- Consultants: Create detailed valuation reports for your clients based on J. B. Chemicals & Pharmaceuticals Limited.
- Students and Educators: Utilize actual market data to practice and teach valuation strategies.
What the Template Includes
- Operating and Balance Sheet Data: Pre-filled historical data and forecasts for J. B. Chemicals & Pharmaceuticals Limited (JBCHEPHARMNS), including revenue, EBITDA, EBIT, and capital expenditures.
- WACC Calculation: A dedicated sheet for the Weighted Average Cost of Capital (WACC), featuring parameters such as Beta, risk-free rate, and share price.
- DCF Valuation (Unlevered and Levered): Customizable Discounted Cash Flow models to illustrate intrinsic value with comprehensive calculations.
- Financial Statements: Pre-loaded annual and quarterly financial statements to assist in analysis.
- Key Ratios: Includes profitability, leverage, and efficiency ratios for J. B. Chemicals & Pharmaceuticals Limited (JBCHEPHARMNS).
- Dashboard and Charts: A visual overview of valuation outputs and assumptions for straightforward result analysis.
Disclaimer
All information, articles, and product details provided on this website are for general informational and educational purposes only. We do not claim any ownership over, nor do we intend to infringe upon, any trademarks, copyrights, logos, brand names, or other intellectual property mentioned or depicted on this site. Such intellectual property remains the property of its respective owners, and any references here are made solely for identification or informational purposes, without implying any affiliation, endorsement, or partnership.
We make no representations or warranties, express or implied, regarding the accuracy, completeness, or suitability of any content or products presented. Nothing on this website should be construed as legal, tax, investment, financial, medical, or other professional advice. In addition, no part of this site—including articles or product references—constitutes a solicitation, recommendation, endorsement, advertisement, or offer to buy or sell any securities, franchises, or other financial instruments, particularly in jurisdictions where such activity would be unlawful.
All content is of a general nature and may not address the specific circumstances of any individual or entity. It is not a substitute for professional advice or services. Any actions you take based on the information provided here are strictly at your own risk. You accept full responsibility for any decisions or outcomes arising from your use of this website and agree to release us from any liability in connection with your use of, or reliance upon, the content or products found herein.