
|
Jabil Inc. (JBL) Évaluation DCF |
Entièrement Modifiable: Adapté À Vos Besoins Dans Excel Ou Sheets
Conception Professionnelle: Modèles Fiables Et Conformes Aux Normes Du Secteur
Pré-Construits Pour Une Utilisation Rapide Et Efficace
Compatible MAC/PC, entièrement débloqué
Aucune Expertise N'Est Requise; Facile À Suivre
Jabil Inc. (JBL) Bundle
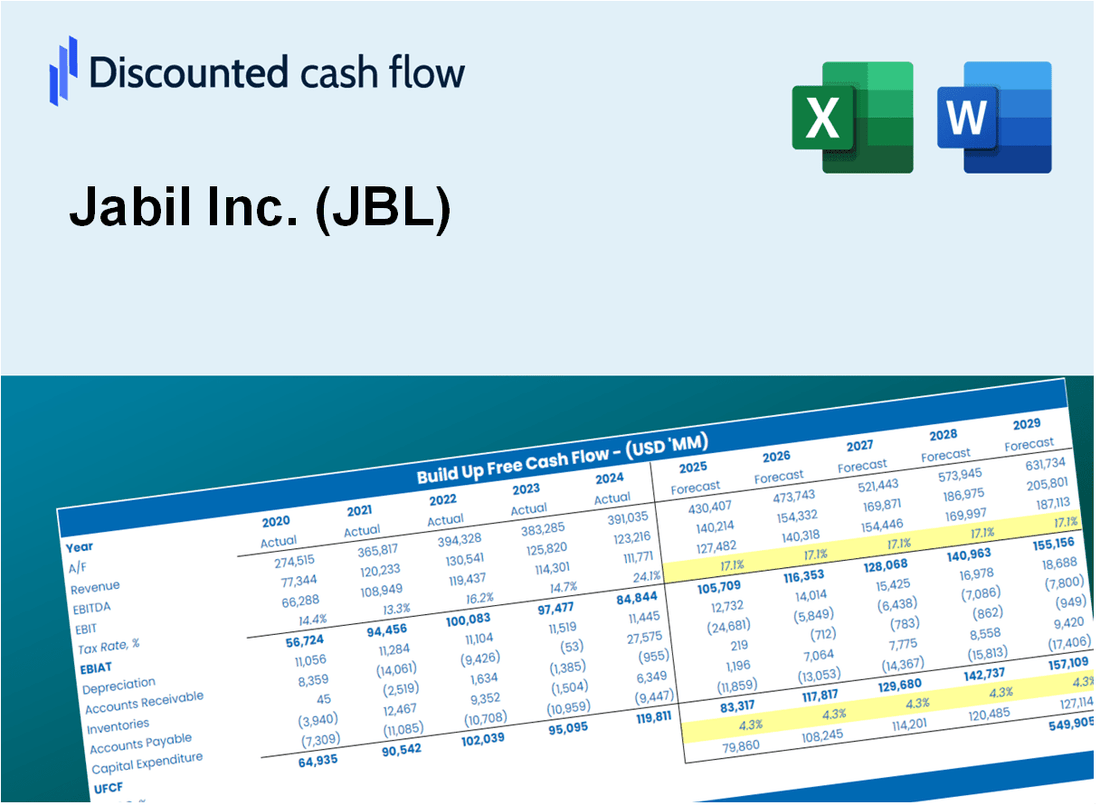
Conçu pour la précision, notre calculatrice DCF de Jabil Inc. (JBL) vous permet d'évaluer l'évaluation de Jabil à l'aide de données financières réelles et offre une flexibilité complète pour modifier tous les paramètres clés pour une meilleure prévision.
What You Will Get
- Real JBL Financial Data: Pre-filled with Jabil Inc.’s historical and projected data for precise analysis.
- Fully Editable Template: Modify key inputs like revenue growth, WACC, and EBITDA % with ease.
- Automatic Calculations: See Jabil Inc.’s intrinsic value update instantly based on your changes.
- Professional Valuation Tool: Designed for investors, analysts, and consultants seeking accurate DCF results.
- User-Friendly Design: Simple structure and clear instructions for all experience levels.
Key Features
- Comprehensive DCF Calculator: Offers detailed unlevered and levered DCF valuation models tailored for Jabil Inc. (JBL).
- WACC Calculator: Features a pre-built Weighted Average Cost of Capital sheet with customizable inputs specific to Jabil Inc. (JBL).
- Customizable Forecast Assumptions: Adjust growth rates, capital expenditures, and discount rates to fit Jabil Inc. (JBL) projections.
- Integrated Financial Ratios: Evaluate profitability, leverage, and efficiency ratios relevant to Jabil Inc. (JBL).
- Interactive Dashboard and Charts: Visual outputs summarize key valuation metrics for Jabil Inc. (JBL) for straightforward analysis.
How It Works
- 1. Access the Template: Download and open the Excel file containing Jabil Inc.'s (JBL) preloaded financial data.
- 2. Adjust Key Inputs: Modify essential variables such as growth projections, WACC, and capital expenditures.
- 3. Analyze Results in Real-Time: The DCF model automatically computes intrinsic value and NPV based on your inputs.
- 4. Explore Different Scenarios: Evaluate various forecasts to understand a range of valuation possibilities.
- 5. Make Informed Decisions: Present detailed valuation analyses to enhance your strategic planning.
Why Choose This Calculator for Jabil Inc. (JBL)?
- Accurate Data: Up-to-date Jabil financials ensure dependable valuation outcomes.
- Customizable: Modify essential parameters such as growth rates, WACC, and tax rates to align with your forecasts.
- Time-Saving: Pre-configured calculations save you from starting from the ground up.
- Professional-Grade Tool: Tailored for investors, analysts, and consultants focused on Jabil Inc. (JBL).
- User-Friendly: Streamlined design and clear instructions make it accessible for all users.
Who Should Use Jabil Inc. (JBL)?
- Manufacturers: Enhance production efficiency with Jabil's advanced manufacturing solutions.
- Product Designers: Leverage innovative design services to bring concepts to market faster.
- Supply Chain Managers: Optimize logistics and inventory management through Jabil's integrated systems.
- Investors: Analyze growth potential with insights from Jabil's performance metrics and market trends.
- Students and Educators: Utilize Jabil's case studies as a resource for learning about manufacturing and technology.
What the Template Contains
- Preloaded JBL Data: Historical and projected financial data, including revenue, EBIT, and capital expenditures.
- DCF and WACC Models: Professional-grade sheets for calculating intrinsic value and Weighted Average Cost of Capital.
- Editable Inputs: Yellow-highlighted cells for adjusting revenue growth, tax rates, and discount rates.
- Financial Statements: Comprehensive annual and quarterly financials for deeper analysis.
- Key Ratios: Profitability, leverage, and efficiency ratios to evaluate performance.
- Dashboard and Charts: Visual summaries of valuation outcomes and assumptions.
Disclaimer
All information, articles, and product details provided on this website are for general informational and educational purposes only. We do not claim any ownership over, nor do we intend to infringe upon, any trademarks, copyrights, logos, brand names, or other intellectual property mentioned or depicted on this site. Such intellectual property remains the property of its respective owners, and any references here are made solely for identification or informational purposes, without implying any affiliation, endorsement, or partnership.
We make no representations or warranties, express or implied, regarding the accuracy, completeness, or suitability of any content or products presented. Nothing on this website should be construed as legal, tax, investment, financial, medical, or other professional advice. In addition, no part of this site—including articles or product references—constitutes a solicitation, recommendation, endorsement, advertisement, or offer to buy or sell any securities, franchises, or other financial instruments, particularly in jurisdictions where such activity would be unlawful.
All content is of a general nature and may not address the specific circumstances of any individual or entity. It is not a substitute for professional advice or services. Any actions you take based on the information provided here are strictly at your own risk. You accept full responsibility for any decisions or outcomes arising from your use of this website and agree to release us from any liability in connection with your use of, or reliance upon, the content or products found herein.