
|
John B. Sanfilippo & SON, Inc. (JBSS) Évaluation DCF |
Entièrement Modifiable: Adapté À Vos Besoins Dans Excel Ou Sheets
Conception Professionnelle: Modèles Fiables Et Conformes Aux Normes Du Secteur
Pré-Construits Pour Une Utilisation Rapide Et Efficace
Compatible MAC/PC, entièrement débloqué
Aucune Expertise N'Est Requise; Facile À Suivre
John B. Sanfilippo & Son, Inc. (JBSS) Bundle
Simplifier John B. Sanfilippo & Évaluation de Son, Inc. (JBSS) avec cette calculatrice DCF personnalisable! Avec le vrai John B. Sanfilippo & SON, Inc. (JBSS) Financials and Adjustable Prévisions Antaires, vous pouvez tester des scénarios et découvrir John B. Sanfilippo & Son, Inc. (JBSS), juste valeur en quelques minutes.
What You Will Get
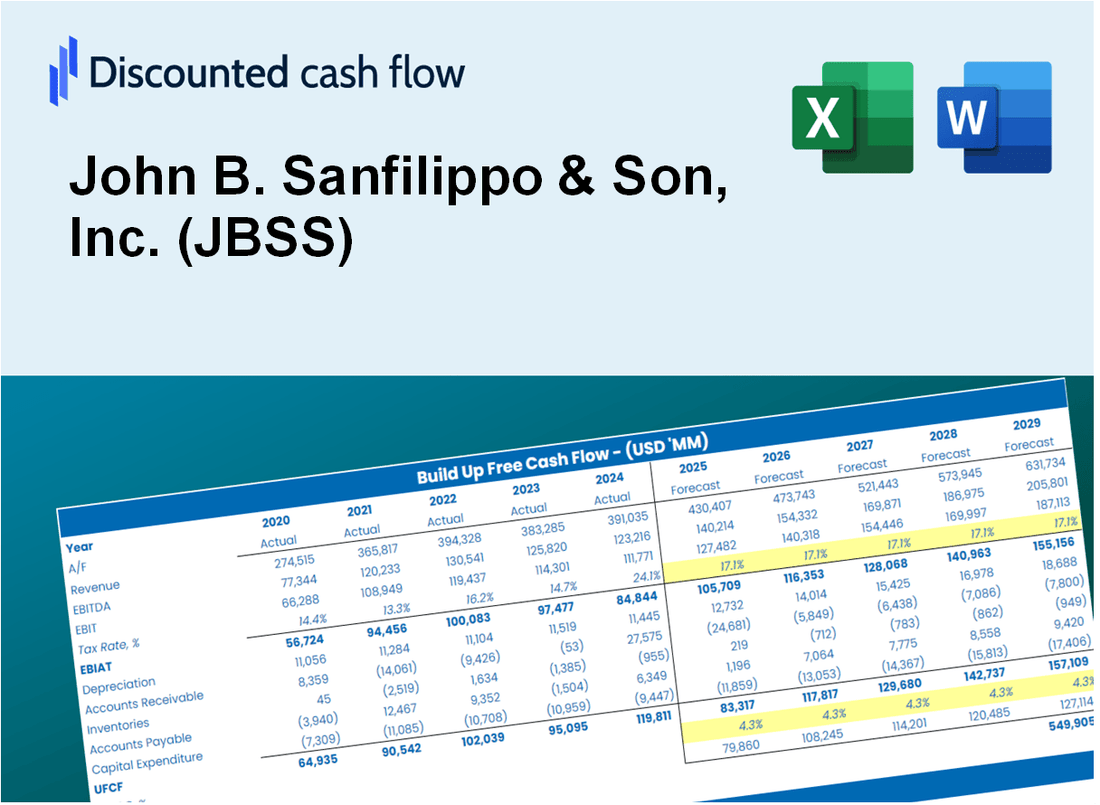
- Real JBSS Data: Preloaded financials – from revenue to EBIT – based on actual and projected figures.
- Full Customization: Adjust all critical parameters (yellow cells) like WACC, growth %, and tax rates.
- Instant Valuation Updates: Automatic recalculations to analyze the impact of changes on JBSS’s fair value.
- Versatile Excel Template: Tailored for quick edits, scenario testing, and detailed projections.
- Time-Saving and Accurate: Skip building models from scratch while maintaining precision and flexibility.
Key Features
- Real-Life JBSS Data: Pre-filled with John B. Sanfilippo & Son, Inc.'s historical financials and future projections.
- Fully Customizable Inputs: Modify revenue growth, profit margins, WACC, tax rates, and capital expenditures to suit your analysis.
- Dynamic Valuation Model: Automatic recalculations of Net Present Value (NPV) and intrinsic value based on your adjusted inputs.
- Scenario Testing: Develop various forecasting scenarios to evaluate different valuation results.
- User-Friendly Design: Intuitive, organized, and crafted for both professionals and newcomers.
How It Works
- Download the Template: Gain immediate access to the Excel-based JBSS DCF Calculator.
- Input Your Assumptions: Modify the yellow-highlighted cells for growth rates, WACC, margins, and additional factors.
- Instant Calculations: The model automatically calculates the intrinsic value of John B. Sanfilippo & Son, Inc. (JBSS).
- Test Scenarios: Experiment with various assumptions to assess potential changes in valuation.
- Analyze and Decide: Utilize the results to inform your investment or financial analysis decisions.
Why Choose JBSS?
- Quality Products: Our commitment to excellence ensures top-notch products for our customers.
- Industry Expertise: Decades of experience in the nut and snack industry guarantee reliable service.
- Sustainable Practices: We prioritize environmentally friendly processes in our operations.
- Customer-Centric Approach: Our team is dedicated to understanding and meeting your unique needs.
- Proven Track Record: Trusted by retailers and consumers alike, JBSS stands for quality and integrity.
Who Should Use John B. Sanfilippo & Son, Inc. (JBSS)?
- Investors: Gain insights and make informed decisions with a leading player in the nut industry.
- Financial Analysts: Analyze market trends and performance metrics of a well-established company.
- Consultants: Utilize JBSS's data for impactful client recommendations and strategic planning.
- Food Industry Enthusiasts: Explore the dynamics of the nut market and its growth potential.
- Educators and Students: Incorporate JBSS as a case study in finance and business courses.
What the Template Contains
- Historical Data: Includes John B. Sanfilippo & Son, Inc.'s (JBSS) past financials and baseline forecasts.
- DCF and Levered DCF Models: Detailed templates to calculate John B. Sanfilippo & Son, Inc.'s (JBSS) intrinsic value.
- WACC Sheet: Pre-built calculations for Weighted Average Cost of Capital.
- Editable Inputs: Modify key drivers like growth rates, EBITDA %, and CAPEX assumptions.
- Quarterly and Annual Statements: A complete breakdown of John B. Sanfilippo & Son, Inc.'s (JBSS) financials.
- Interactive Dashboard: Visualize valuation results and projections dynamically.
Disclaimer
All information, articles, and product details provided on this website are for general informational and educational purposes only. We do not claim any ownership over, nor do we intend to infringe upon, any trademarks, copyrights, logos, brand names, or other intellectual property mentioned or depicted on this site. Such intellectual property remains the property of its respective owners, and any references here are made solely for identification or informational purposes, without implying any affiliation, endorsement, or partnership.
We make no representations or warranties, express or implied, regarding the accuracy, completeness, or suitability of any content or products presented. Nothing on this website should be construed as legal, tax, investment, financial, medical, or other professional advice. In addition, no part of this site—including articles or product references—constitutes a solicitation, recommendation, endorsement, advertisement, or offer to buy or sell any securities, franchises, or other financial instruments, particularly in jurisdictions where such activity would be unlawful.
All content is of a general nature and may not address the specific circumstances of any individual or entity. It is not a substitute for professional advice or services. Any actions you take based on the information provided here are strictly at your own risk. You accept full responsibility for any decisions or outcomes arising from your use of this website and agree to release us from any liability in connection with your use of, or reliance upon, the content or products found herein.