
|
James Hardie Industries Plc (JHX) Évaluation DCF |
Entièrement Modifiable: Adapté À Vos Besoins Dans Excel Ou Sheets
Conception Professionnelle: Modèles Fiables Et Conformes Aux Normes Du Secteur
Pré-Construits Pour Une Utilisation Rapide Et Efficace
Compatible MAC/PC, entièrement débloqué
Aucune Expertise N'Est Requise; Facile À Suivre
James Hardie Industries plc (JHX) Bundle
Évaluez les perspectives financières de James Hardie Industries plc comme un expert! Cette calculatrice DCF (JHX) fournit des données financières pré-remplies ainsi que la flexibilité pour modifier la croissance des revenus, le WACC, les marges et d'autres hypothèses essentielles pour s'aligner sur vos projections.
What You Will Get
- Editable Excel Template: A fully customizable Excel-based DCF Calculator featuring pre-filled real JHX financials.
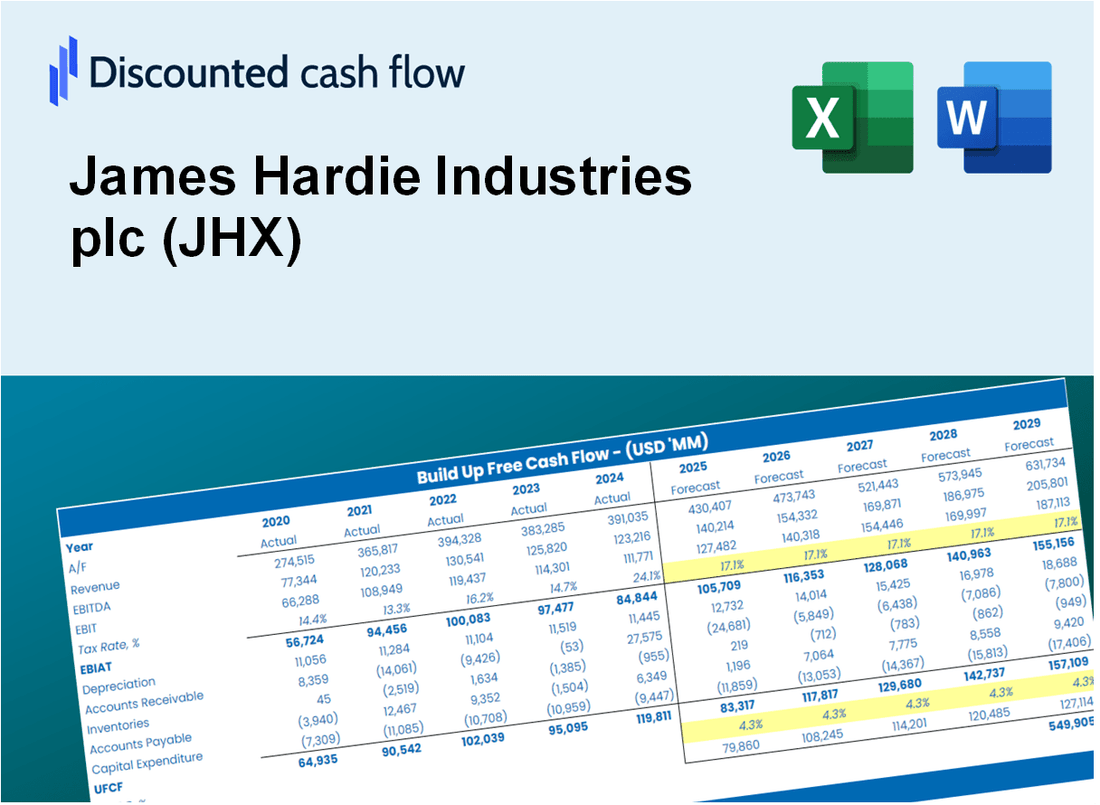
- Real-World Data: Historical data and forward-looking estimates (as indicated in the yellow cells).
- Forecast Flexibility: Adjust forecast assumptions such as revenue growth, EBITDA %, and WACC.
- Automatic Calculations: Instantly observe the impact of your inputs on James Hardie’s valuation.
- Professional Tool: Designed for investors, CFOs, consultants, and financial analysts.
- User-Friendly Design: Organized for clarity and ease of use, complete with step-by-step instructions.
Key Features
- Comprehensive JHX Data: Pre-loaded with James Hardie’s historical performance metrics and future projections.
- Flexible Input Options: Modify revenue growth rates, profit margins, discount rates, tax implications, and capital investments.
- Interactive Valuation Model: Instant updates to Net Present Value (NPV) and intrinsic value reflecting your customized inputs.
- Scenario Analysis: Develop various forecasting scenarios to explore different valuation possibilities.
- Intuitive Interface: Streamlined, organized, and accessible for both seasoned professionals and newcomers.
How It Works
- Step 1: Download the Excel file.
- Step 2: Review James Hardie Industries plc’s pre-filled financial data and forecasts.
- Step 3: Modify critical inputs like revenue growth, WACC, and tax rates (highlighted cells).
- Step 4: Watch the DCF model update instantly as you tweak assumptions.
- Step 5: Analyze the outputs and use the results for investment decisions.
Why Choose This Calculator for James Hardie Industries (JHX)?
- User-Friendly Interface: Ideal for both novices and seasoned professionals.
- Customizable Inputs: Adjust parameters effortlessly to suit your analysis needs.
- Real-Time Feedback: Observe immediate changes in James Hardie’s valuation as you tweak inputs.
- Preloaded Data: Comes with James Hardie’s actual financial figures for swift evaluations.
- Relied Upon by Experts: Favored by investors and analysts for making well-informed choices.
Who Should Use This Product?
- Individual Investors: Gain insights to make informed decisions on buying or selling James Hardie Industries plc (JHX) stock.
- Financial Analysts: Enhance valuation processes with comprehensive financial models tailored for James Hardie Industries plc (JHX).
- Consultants: Provide clients with accurate and timely valuation insights regarding James Hardie Industries plc (JHX).
- Business Owners: Learn how companies like James Hardie Industries plc (JHX) are valued to inform your own business strategies.
- Finance Students: Explore valuation methodologies using real-world data from James Hardie Industries plc (JHX).
What the Template Contains
- Historical Data: Includes James Hardie’s past financials and baseline forecasts.
- DCF and Levered DCF Models: Detailed templates to calculate James Hardie’s intrinsic value.
- WACC Sheet: Pre-built calculations for Weighted Average Cost of Capital.
- Editable Inputs: Modify key drivers like growth rates, EBITDA %, and CAPEX assumptions.
- Quarterly and Annual Statements: A complete breakdown of James Hardie’s financials.
- Interactive Dashboard: Visualize valuation results and projections dynamically.
Disclaimer
All information, articles, and product details provided on this website are for general informational and educational purposes only. We do not claim any ownership over, nor do we intend to infringe upon, any trademarks, copyrights, logos, brand names, or other intellectual property mentioned or depicted on this site. Such intellectual property remains the property of its respective owners, and any references here are made solely for identification or informational purposes, without implying any affiliation, endorsement, or partnership.
We make no representations or warranties, express or implied, regarding the accuracy, completeness, or suitability of any content or products presented. Nothing on this website should be construed as legal, tax, investment, financial, medical, or other professional advice. In addition, no part of this site—including articles or product references—constitutes a solicitation, recommendation, endorsement, advertisement, or offer to buy or sell any securities, franchises, or other financial instruments, particularly in jurisdictions where such activity would be unlawful.
All content is of a general nature and may not address the specific circumstances of any individual or entity. It is not a substitute for professional advice or services. Any actions you take based on the information provided here are strictly at your own risk. You accept full responsibility for any decisions or outcomes arising from your use of this website and agree to release us from any liability in connection with your use of, or reliance upon, the content or products found herein.