
|
J.Jill, Inc. (JILL) DCF Valuation |
Entièrement Modifiable: Adapté À Vos Besoins Dans Excel Ou Sheets
Conception Professionnelle: Modèles Fiables Et Conformes Aux Normes Du Secteur
Pré-Construits Pour Une Utilisation Rapide Et Efficace
Compatible MAC/PC, entièrement débloqué
Aucune Expertise N'Est Requise; Facile À Suivre
J.Jill, Inc. (JILL) Bundle
Looking to assess J.Jill, Inc.'s intrinsic value? Our J.Jill (JILL) DCF Calculator integrates real-world data with extensive customization features, enabling you to refine your forecasts and enhance your investment choices.
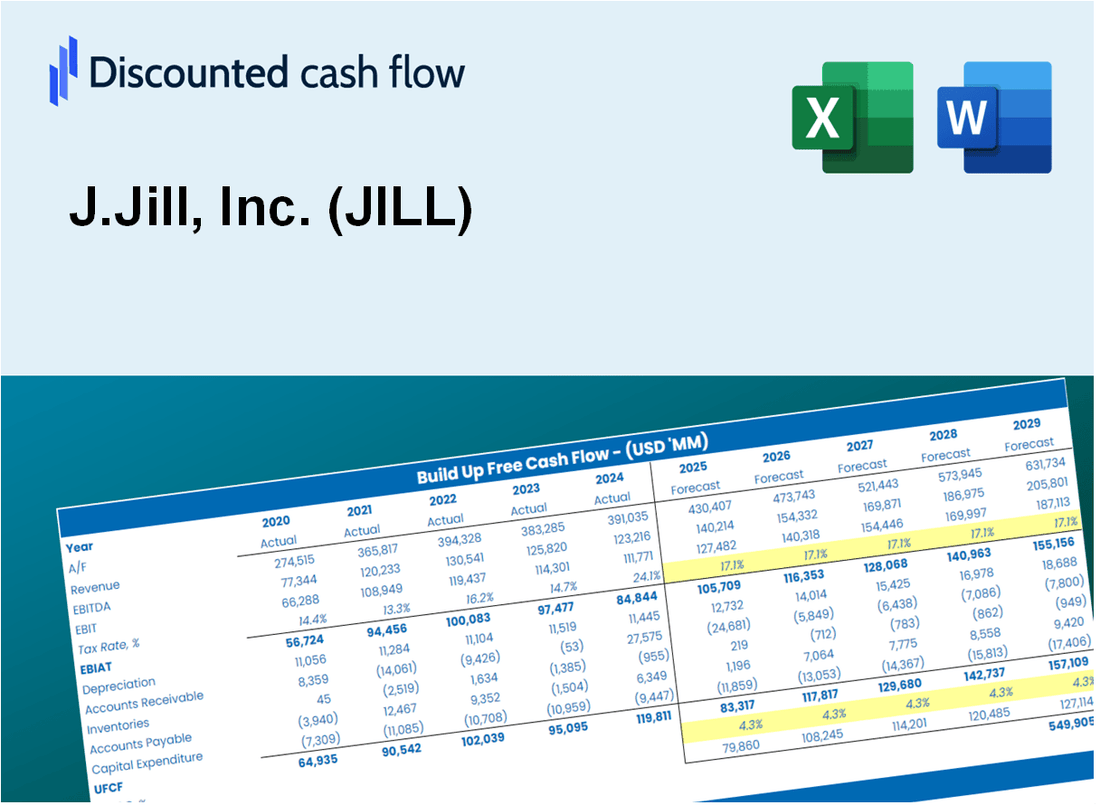
Discounted Cash Flow (DCF) - (USD MM)
| Year | AY1 2020 |
AY2 2021 |
AY3 2022 |
AY4 2023 |
AY5 2024 |
FY1 2025 |
FY2 2026 |
FY3 2027 |
FY4 2028 |
FY5 2029 |
|---|---|---|---|---|---|---|---|---|---|---|
| Revenue | 421.3 | 585.2 | 615.3 | 604.7 | 610.9 | 612.7 | 613.3 | 613.5 | 613.5 | 613.5 |
| Revenue Growth, % | 0 | 38.92 | 5.14 | -1.72 | 1.02 | 0.30854 | 0.09290455 | 0.02797408 | 0.00842315 | 0.00253626 |
| EBITDA | -135.7 | 28.2 | 104.5 | 96.3 | 75.7 | 22.0 | 22.0 | 22.0 | 22.0 | 22.0 |
| EBITDA, % | -32.2 | 4.82 | 16.98 | 15.92 | 12.39 | 3.58 | 3.58 | 3.58 | 3.58 | 3.58 |
| Depreciation | 33.7 | 29.3 | 25.8 | 22.9 | 6.0 | 26.9 | 26.9 | 26.9 | 26.9 | 26.9 |
| Depreciation, % | 8 | 5 | 4.19 | 3.79 | 0.9855 | 4.39 | 4.39 | 4.39 | 4.39 | 4.39 |
| EBIT | -169.3 | -1.0 | 78.7 | 73.3 | 69.7 | -5.0 | -5.0 | -5.0 | -5.0 | -5.0 |
| EBIT, % | -40.2 | -0.17754 | 12.8 | 12.13 | 11.41 | -0.80814 | -0.80814 | -0.80814 | -0.80814 | -0.80814 |
| Total Cash | 4.4 | 36.0 | 87.1 | 62.2 | 35.4 | 43.8 | 51.9 | 59.9 | 67.8 | 75.6 |
| Total Cash, percent | .0 | .0 | .0 | .0 | .0 | .0 | .0 | .0 | .0 | .0 |
| Account Receivables | 7.8 | 5.8 | 7.4 | 6.8 | 5.3 | 7.4 | 7.4 | 7.4 | 7.4 | 7.4 |
| Account Receivables, % | 1.85 | 0.99298 | 1.2 | 1.13 | 0.86731 | 1.21 | 1.21 | 1.21 | 1.21 | 1.21 |
| Inventories | 58.0 | 56.0 | 50.6 | 53.3 | 61.3 | 61.8 | 61.8 | 61.9 | 61.9 | 61.9 |
| Inventories, % | 13.78 | 9.57 | 8.22 | 8.81 | 10.03 | 10.08 | 10.08 | 10.08 | 10.08 | 10.08 |
| Accounts Payable | 56.3 | 49.9 | 39.3 | 41.1 | 52.0 | 53.4 | 53.5 | 53.5 | 53.5 | 53.5 |
| Accounts Payable, % | 13.36 | 8.53 | 6.39 | 6.8 | 8.51 | 8.72 | 8.72 | 8.72 | 8.72 | 8.72 |
| Capital Expenditure | -3.8 | -5.5 | -15.1 | -16.9 | -14.3 | -11.5 | -11.6 | -11.6 | -11.6 | -11.6 |
| Capital Expenditure, % | -0.90324 | -0.9354 | -2.45 | -2.8 | -2.34 | -1.88 | -1.88 | -1.88 | -1.88 | -1.88 |
| Tax Rate, % | 26.86 | 26.86 | 26.86 | 26.86 | 26.86 | 26.86 | 26.86 | 26.86 | 26.86 | 26.86 |
| EBITAT | -125.8 | -1.5 | 56.6 | 53.8 | 51.0 | -3.9 | -3.9 | -3.9 | -3.9 | -3.9 |
| Depreciation | ||||||||||
| Changes in Account Receivables | ||||||||||
| Changes in Inventories | ||||||||||
| Changes in Accounts Payable | ||||||||||
| Capital Expenditure | ||||||||||
| UFCF | -105.5 | 20.0 | 60.5 | 59.5 | 47.1 | 10.3 | 11.5 | 11.5 | 11.5 | 11.5 |
| WACC, % | 6.23 | 7.1 | 6.15 | 6.2 | 6.19 | 6.38 | 6.38 | 6.38 | 6.38 | 6.38 |
| PV UFCF | ||||||||||
| SUM PV UFCF | 46.8 | |||||||||
| Long Term Growth Rate, % | 0.50 | |||||||||
| Free cash flow (T + 1) | 12 | |||||||||
| Terminal Value | 196 | |||||||||
| Present Terminal Value | 144 | |||||||||
| Enterprise Value | 191 | |||||||||
| Net Debt | 173 | |||||||||
| Equity Value | 18 | |||||||||
| Diluted Shares Outstanding, MM | 15 | |||||||||
| Equity Value Per Share | 1.16 |
What You Will Receive
- Comprehensive Financial Model: J.Jill’s actual data provides an accurate DCF valuation.
- Complete Forecast Control: Modify revenue growth, profit margins, WACC, and other essential factors.
- Real-Time Calculations: Automatic updates allow you to view outcomes instantly as adjustments are made.
- Professional-Grade Template: A polished Excel file crafted for high-quality valuation presentations.
- Flexible and Reusable: Designed for adaptability, enabling repeated use for in-depth forecasting.
Key Features
- 🔍 Real-Life J.Jill Financials: Pre-filled historical and projected data for J.Jill, Inc. (JILL).
- ✏️ Fully Customizable Inputs: Adjust all critical parameters (yellow cells) like WACC, growth %, and tax rates.
- 📊 Professional DCF Valuation: Built-in formulas calculate J.Jill’s intrinsic value using the Discounted Cash Flow method.
- ⚡ Instant Results: Visualize J.Jill’s valuation instantly after making changes.
- Scenario Analysis: Test and compare outcomes for various financial assumptions side-by-side.
How It Works
- 1. Open the Template: Download and launch the Excel file featuring J.Jill, Inc.'s (JILL) preloaded data.
- 2. Edit Assumptions: Adjust key parameters such as growth rates, WACC, and capital expenditures.
- 3. View Results Instantly: The DCF model will automatically compute intrinsic value and NPV.
- 4. Test Scenarios: Evaluate various forecasts to explore different valuation results.
- 5. Use with Confidence: Deliver professional valuation insights to bolster your decision-making.
Why Choose This Calculator for J.Jill, Inc. (JILL)?
- Accurate Data: Access to real J.Jill financials guarantees dependable valuation outcomes.
- Customizable: Tailor essential parameters such as growth rates, WACC, and tax rates to align with your forecasts.
- Time-Saving: Pre-configured calculations save you from starting from the ground up.
- Professional-Grade Tool: Crafted for investors, analysts, and consultants in the retail sector.
- User-Friendly: Easy-to-navigate design and clear instructions cater to users of all experience levels.
Who Should Use This Product?
- Fashion Retail Investors: Create comprehensive and accurate valuation models for J.Jill, Inc. (JILL) stock analysis.
- Corporate Finance Teams: Evaluate valuation scenarios to inform strategic decisions within the retail sector.
- Consultants and Advisors: Deliver precise valuation insights to clients interested in J.Jill, Inc. (JILL).
- Students and Educators: Utilize real-world data to learn and teach financial modeling in the fashion industry.
- Brand Enthusiasts: Gain insights into how fashion retailers like J.Jill, Inc. (JILL) are valued in the marketplace.
What the Template Contains
- Historical Data: Includes J.Jill, Inc.'s past financials and baseline forecasts.
- DCF and Levered DCF Models: Detailed templates to calculate J.Jill, Inc.'s intrinsic value.
- WACC Sheet: Pre-built calculations for Weighted Average Cost of Capital.
- Editable Inputs: Modify key drivers like growth rates, EBITDA %, and CAPEX assumptions.
- Quarterly and Annual Statements: A complete breakdown of J.Jill, Inc.'s financials.
- Interactive Dashboard: Visualize valuation results and projections dynamically.
Disclaimer
All information, articles, and product details provided on this website are for general informational and educational purposes only. We do not claim any ownership over, nor do we intend to infringe upon, any trademarks, copyrights, logos, brand names, or other intellectual property mentioned or depicted on this site. Such intellectual property remains the property of its respective owners, and any references here are made solely for identification or informational purposes, without implying any affiliation, endorsement, or partnership.
We make no representations or warranties, express or implied, regarding the accuracy, completeness, or suitability of any content or products presented. Nothing on this website should be construed as legal, tax, investment, financial, medical, or other professional advice. In addition, no part of this site—including articles or product references—constitutes a solicitation, recommendation, endorsement, advertisement, or offer to buy or sell any securities, franchises, or other financial instruments, particularly in jurisdictions where such activity would be unlawful.
All content is of a general nature and may not address the specific circumstances of any individual or entity. It is not a substitute for professional advice or services. Any actions you take based on the information provided here are strictly at your own risk. You accept full responsibility for any decisions or outcomes arising from your use of this website and agree to release us from any liability in connection with your use of, or reliance upon, the content or products found herein.