
|
Pneu jk & Industries Limited (JKTYRE.NS) Évaluation DCF |
Entièrement Modifiable: Adapté À Vos Besoins Dans Excel Ou Sheets
Conception Professionnelle: Modèles Fiables Et Conformes Aux Normes Du Secteur
Pré-Construits Pour Une Utilisation Rapide Et Efficace
Compatible MAC/PC, entièrement débloqué
Aucune Expertise N'Est Requise; Facile À Suivre
JK Tyre & Industries Limited (JKTYRE.NS) Bundle
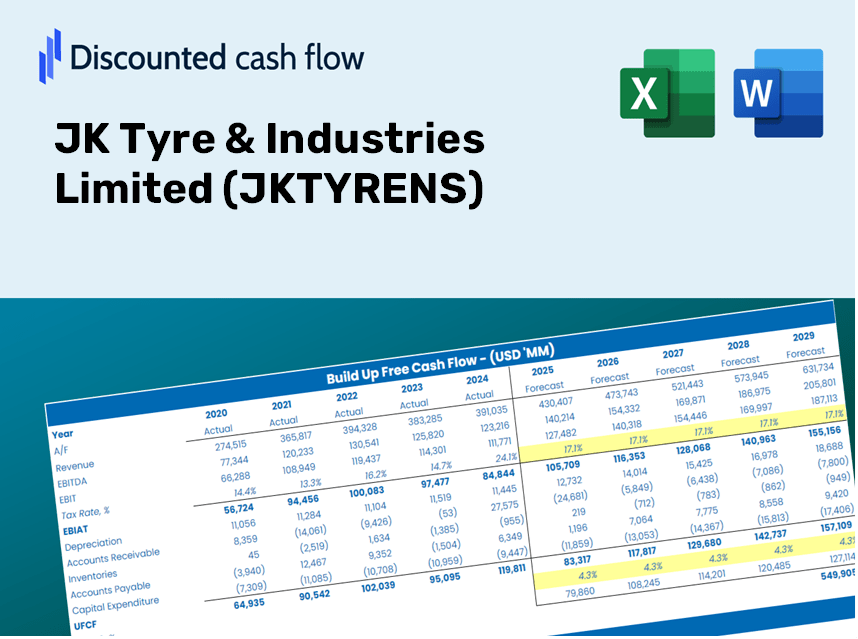
Découvrez la vraie valeur de JK Tire & Industries Limited (JKTYRENS) avec notre calculatrice avancée DCF! Ajustez les hypothèses essentielles, explorez divers scénarios et examinez comment les différents facteurs affectent le pneu JK & Industries Limited (JKTYRENS) Évaluation - Tout dans un modèle Excel complet.
Discounted Cash Flow (DCF) - (USD MM)
| Year | AY1 2021 |
AY2 2022 |
AY3 2023 |
AY4 2024 |
AY5 2025 |
FY1 2026 |
FY2 2027 |
FY3 2028 |
FY4 2029 |
FY5 2030 |
|---|---|---|---|---|---|---|---|---|---|---|
| Revenue | 90,430.5 | 118,529.0 | 145,200.3 | 148,694.2 | 146,929.2 | 167,056.0 | 189,939.8 | 215,958.2 | 245,540.8 | 279,175.7 |
| Revenue Growth, % | 0 | 31.07 | 22.5 | 2.41 | -1.19 | 13.7 | 13.7 | 13.7 | 13.7 | 13.7 |
| EBITDA | 13,867.9 | 11,133.6 | 12,727.1 | 20,944.8 | 15,985.5 | 19,532.0 | 22,207.5 | 25,249.5 | 28,708.3 | 32,640.8 |
| EBITDA, % | 15.34 | 9.39 | 8.77 | 14.09 | 10.88 | 11.69 | 11.69 | 11.69 | 11.69 | 11.69 |
| Depreciation | 3,865.9 | 3,852.6 | 4,069.6 | 4,366.3 | 4,564.9 | 5,469.9 | 6,219.2 | 7,071.1 | 8,039.7 | 9,141.0 |
| Depreciation, % | 4.27 | 3.25 | 2.8 | 2.94 | 3.11 | 3.27 | 3.27 | 3.27 | 3.27 | 3.27 |
| EBIT | 10,002.0 | 7,281.0 | 8,657.5 | 16,578.5 | 11,420.6 | 14,062.1 | 15,988.3 | 18,178.5 | 20,668.6 | 23,499.9 |
| EBIT, % | 11.06 | 6.14 | 5.96 | 11.15 | 7.77 | 8.42 | 8.42 | 8.42 | 8.42 | 8.42 |
| Total Cash | 938.9 | 1,753.3 | 4,489.1 | 7,540.0 | 7,226.7 | 5,211.6 | 5,925.5 | 6,737.2 | 7,660.1 | 8,709.4 |
| Total Cash, percent | .0 | .0 | .0 | .0 | .0 | .0 | .0 | .0 | .0 | .0 |
| Account Receivables | 16,108.1 | 20,191.6 | 23,695.3 | 28,130.0 | 28,831.3 | 29,972.3 | 34,078.0 | 38,746.1 | 44,053.7 | 50,088.3 |
| Account Receivables, % | 17.81 | 17.04 | 16.32 | 18.92 | 19.62 | 17.94 | 17.94 | 17.94 | 17.94 | 17.94 |
| Inventories | 17,892.9 | 24,326.2 | 21,705.3 | 22,815.9 | 25,256.0 | 29,332.3 | 33,350.3 | 37,918.7 | 43,112.9 | 49,018.6 |
| Inventories, % | 19.79 | 20.52 | 14.95 | 15.34 | 17.19 | 17.56 | 17.56 | 17.56 | 17.56 | 17.56 |
| Accounts Payable | 15,740.7 | 21,885.2 | 18,196.3 | 21,572.1 | 18,921.3 | 25,321.6 | 28,790.2 | 32,734.0 | 37,218.0 | 42,316.2 |
| Accounts Payable, % | 17.41 | 18.46 | 12.53 | 14.51 | 12.88 | 15.16 | 15.16 | 15.16 | 15.16 | 15.16 |
| Capital Expenditure | -1,930.9 | -3,142.1 | -4,631.8 | -7,743.0 | -6,387.4 | -5,857.2 | -6,659.5 | -7,571.8 | -8,609.0 | -9,788.3 |
| Capital Expenditure, % | -2.14 | -2.65 | -3.19 | -5.21 | -4.35 | -3.51 | -3.51 | -3.51 | -3.51 | -3.51 |
| Tax Rate, % | 29.98 | 29.98 | 29.98 | 29.98 | 29.98 | 29.98 | 29.98 | 29.98 | 29.98 | 29.98 |
| EBITAT | 5,977.4 | 4,948.6 | 5,525.6 | 10,764.1 | 7,997.2 | 9,182.7 | 10,440.6 | 11,870.8 | 13,496.8 | 15,345.7 |
| Depreciation | ||||||||||
| Changes in Account Receivables | ||||||||||
| Changes in Inventories | ||||||||||
| Changes in Accounts Payable | ||||||||||
| Capital Expenditure | ||||||||||
| UFCF | -10,347.9 | 1,286.8 | 391.7 | 5,217.9 | 382.5 | 9,978.4 | 5,345.1 | 6,077.3 | 6,909.8 | 7,856.3 |
| WACC, % | 6 | 6.26 | 6.13 | 6.16 | 6.32 | 6.17 | 6.17 | 6.17 | 6.17 | 6.17 |
| PV UFCF | ||||||||||
| SUM PV UFCF | 30,479.0 | |||||||||
| Long Term Growth Rate, % | 3.50 | |||||||||
| Free cash flow (T + 1) | 8,131 | |||||||||
| Terminal Value | 304,325 | |||||||||
| Present Terminal Value | 225,575 | |||||||||
| Enterprise Value | 256,054 | |||||||||
| Net Debt | 41,998 | |||||||||
| Equity Value | 214,056 | |||||||||
| Diluted Shares Outstanding, MM | 274 | |||||||||
| Equity Value Per Share | 780.49 |
What You Will Receive
- Genuine JK Tyre Data: Comprehensive financials – spanning revenue to EBIT – derived from actual and projected metrics.
- Complete Customization: Modify all essential variables (yellow cells) such as WACC, growth %, and tax rates.
- Real-Time Valuation Adjustments: Automatic recalculations to assess the effects of changes on JK Tyre's fair value.
- Flexible Excel Template: Designed for swift modifications, scenario analyses, and in-depth forecasting.
- Efficient and Precise: Eliminate the need to construct models from the ground up while ensuring accuracy and adaptability.
Key Features
- Comprehensive DCF Calculator: Offers detailed unlevered and levered DCF valuation models tailored for JK Tyre & Industries Limited (JKTYRENS).
- WACC Calculator: Features a pre-built Weighted Average Cost of Capital sheet with adjustable inputs for precise calculations.
- Customizable Forecast Assumptions: Easily modify growth rates, capital expenditures, and discount rates to fit JK Tyre's financial outlook.
- Integrated Financial Ratios: Assess profitability, leverage, and efficiency ratios specifically for JK Tyre & Industries Limited (JKTYRENS).
- Interactive Dashboard and Charts: Visual representations summarize essential valuation metrics for straightforward analysis.
How It Functions
- 1. Access the Template: Download and open the Excel file containing JK Tyre & Industries Limited’s (JKTYRENS) preloaded data.
- 2. Adjust Inputs: Update key parameters such as growth rates, WACC, and capital expenditures.
- 3. Get Instant Results: The DCF model automatically computes intrinsic value and NPV.
- 4. Explore Scenarios: Evaluate various forecasts to understand different valuation results.
- 5. Present with Assurance: Deliver professional valuation insights to bolster your decision-making process.
Why Opt for This JK Tyre Calculator?
- All-in-One Solution: Offers DCF, WACC, and financial ratio analyses in a single platform.
- Flexible Inputs: Modify the highlighted cells to explore different financial scenarios.
- Comprehensive Analysis: Automatically computes the intrinsic value and Net Present Value for JK Tyre & Industries Limited (JKTYRENS).
- Pre-Loaded Information: Features historical and projected data to provide solid foundational metrics.
- High-Quality Standards: Perfect for financial analysts, investors, and business consultants seeking reliable insights.
Who Can Benefit from JK Tyre & Industries Limited (JKTYRENS)?
- Automobile Engineering Students: Understand tire technology and apply it to real-world scenarios.
- Researchers: Utilize industry-standard models for analysis in projects or publications.
- Investors: Evaluate your investment strategies and assess the market performance of JK Tyre.
- Market Analysts: Enhance your efficiency with a customizable financial model tailored for JKTYRENS.
- Entrepreneurs: Learn from the strategies employed by major players in the tire industry like JK Tyre.
Overview of the Template
- Pre-Filled Data: Features historical financials and forecasts for JK Tyre & Industries Limited (JKTYRENS).
- Discounted Cash Flow Model: An editable DCF valuation model with automatic calculations for user convenience.
- Weighted Average Cost of Capital (WACC): A specific sheet dedicated to calculating WACC using customized inputs.
- Key Financial Ratios: Assess JK Tyre's profitability, operational efficiency, and leverage metrics.
- Customizable Inputs: Easily modify revenue growth, profit margins, and tax rates as needed.
- Intuitive Dashboard: Visual charts and tables that summarize important valuation outcomes.
Disclaimer
All information, articles, and product details provided on this website are for general informational and educational purposes only. We do not claim any ownership over, nor do we intend to infringe upon, any trademarks, copyrights, logos, brand names, or other intellectual property mentioned or depicted on this site. Such intellectual property remains the property of its respective owners, and any references here are made solely for identification or informational purposes, without implying any affiliation, endorsement, or partnership.
We make no representations or warranties, express or implied, regarding the accuracy, completeness, or suitability of any content or products presented. Nothing on this website should be construed as legal, tax, investment, financial, medical, or other professional advice. In addition, no part of this site—including articles or product references—constitutes a solicitation, recommendation, endorsement, advertisement, or offer to buy or sell any securities, franchises, or other financial instruments, particularly in jurisdictions where such activity would be unlawful.
All content is of a general nature and may not address the specific circumstances of any individual or entity. It is not a substitute for professional advice or services. Any actions you take based on the information provided here are strictly at your own risk. You accept full responsibility for any decisions or outcomes arising from your use of this website and agree to release us from any liability in connection with your use of, or reliance upon, the content or products found herein.