
|
Johnson Matthey Plc (JMAT.L) Évaluation DCF |
Entièrement Modifiable: Adapté À Vos Besoins Dans Excel Ou Sheets
Conception Professionnelle: Modèles Fiables Et Conformes Aux Normes Du Secteur
Pré-Construits Pour Une Utilisation Rapide Et Efficace
Compatible MAC/PC, entièrement débloqué
Aucune Expertise N'Est Requise; Facile À Suivre
Johnson Matthey Plc (JMAT.L) Bundle
Vous cherchez à évaluer la valeur intrinsèque de Johnson Matthey plc? Notre calculatrice JMATL DCF intègre des données réelles avec des fonctionnalités de personnalisation étendues, vous permettant d'affiner vos prévisions et d'améliorer votre stratégie d'investissement.
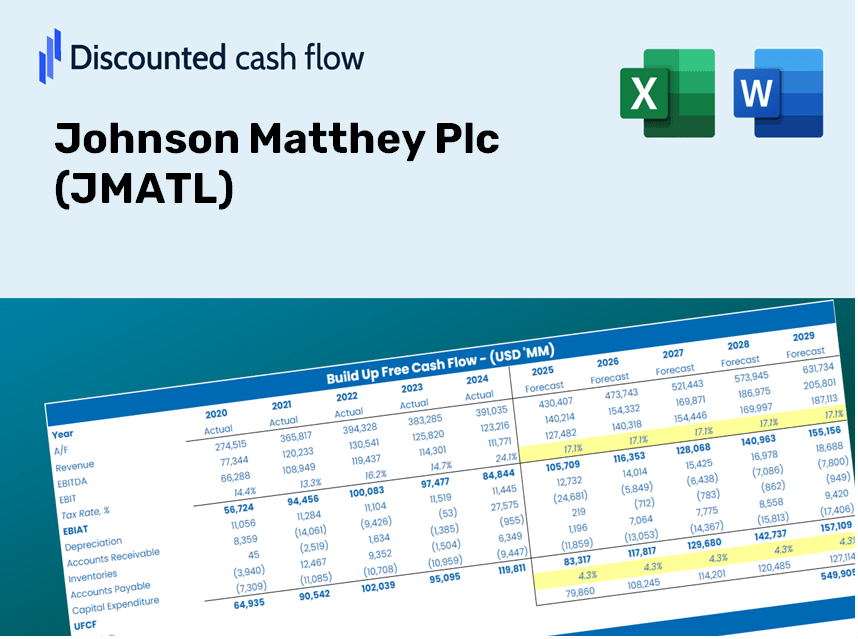
Discounted Cash Flow (DCF) - (USD MM)
| Year | AY1 2021 |
AY2 2022 |
AY3 2023 |
AY4 2024 |
AY5 2025 |
FY1 2026 |
FY2 2027 |
FY3 2028 |
FY4 2029 |
FY5 2030 |
|---|---|---|---|---|---|---|---|---|---|---|
| Revenue | 15,435.0 | 16,025.0 | 14,933.0 | 12,843.0 | 11,674.0 | 10,912.6 | 10,200.8 | 9,535.4 | 8,913.5 | 8,332.1 |
| Revenue Growth, % | 0 | 3.82 | -6.81 | -14 | -9.1 | -6.52 | -6.52 | -6.52 | -6.52 | -6.52 |
| EBITDA | 564.0 | 467.0 | 621.0 | 488.0 | 802.0 | 467.0 | 436.5 | 408.1 | 381.4 | 356.6 |
| EBITDA, % | 3.65 | 2.91 | 4.16 | 3.8 | 6.87 | 4.28 | 4.28 | 4.28 | 4.28 | 4.28 |
| Depreciation | 170.0 | 177.0 | 187.0 | 192.0 | 187.0 | 143.1 | 133.7 | 125.0 | 116.9 | 109.2 |
| Depreciation, % | 1.1 | 1.1 | 1.25 | 1.49 | 1.6 | 1.31 | 1.31 | 1.31 | 1.31 | 1.31 |
| EBIT | 394.0 | 290.0 | 434.0 | 296.0 | 615.0 | 323.9 | 302.8 | 283.0 | 264.6 | 247.3 |
| EBIT, % | 2.55 | 1.81 | 2.91 | 2.3 | 5.27 | 2.97 | 2.97 | 2.97 | 2.97 | 2.97 |
| Total Cash | 625.0 | 418.0 | 697.0 | 542.0 | 898.0 | 507.2 | 474.1 | 443.2 | 414.3 | 387.2 |
| Total Cash, percent | .0 | .0 | .0 | .0 | .0 | .0 | .0 | .0 | .0 | .0 |
| Account Receivables | 2,347.0 | 1,739.0 | 1,811.0 | 1,505.0 | 1,339.0 | 1,339.5 | 1,252.1 | 1,170.4 | 1,094.1 | 1,022.7 |
| Account Receivables, % | 15.21 | 10.85 | 12.13 | 11.72 | 11.47 | 12.27 | 12.27 | 12.27 | 12.27 | 12.27 |
| Inventories | 1,814.0 | 1,549.0 | 1,702.0 | 1,211.0 | 1,011.0 | 1,111.0 | 1,038.6 | 970.8 | 907.5 | 848.3 |
| Inventories, % | 11.75 | 9.67 | 11.4 | 9.43 | 8.66 | 10.18 | 10.18 | 10.18 | 10.18 | 10.18 |
| Accounts Payable | 996.0 | 753.0 | 831.0 | 655.0 | 667.0 | 600.9 | 561.7 | 525.0 | 490.8 | 458.8 |
| Accounts Payable, % | 6.45 | 4.7 | 5.56 | 5.1 | 5.71 | 5.51 | 5.51 | 5.51 | 5.51 | 5.51 |
| Capital Expenditure | -381.0 | -453.0 | -316.0 | -368.0 | -373.0 | -294.0 | -274.8 | -256.9 | -240.2 | -224.5 |
| Capital Expenditure, % | -2.47 | -2.83 | -2.12 | -2.87 | -3.2 | -2.69 | -2.69 | -2.69 | -2.69 | -2.69 |
| Tax Rate, % | 23.25 | 23.25 | 23.25 | 23.25 | 23.25 | 23.25 | 23.25 | 23.25 | 23.25 | 23.25 |
| EBITAT | 360.6 | -150.2 | 347.2 | 194.9 | 472.0 | 203.5 | 190.2 | 177.8 | 166.2 | 155.4 |
| Depreciation | ||||||||||
| Changes in Account Receivables | ||||||||||
| Changes in Inventories | ||||||||||
| Changes in Accounts Payable | ||||||||||
| Capital Expenditure | ||||||||||
| UFCF | -3,015.4 | 203.8 | 71.2 | 639.9 | 664.0 | -114.1 | 169.8 | 158.7 | 148.3 | 138.7 |
| WACC, % | 7.48 | 5.32 | 7.21 | 6.88 | 7.13 | 6.8 | 6.8 | 6.8 | 6.8 | 6.8 |
| PV UFCF | ||||||||||
| SUM PV UFCF | 386.0 | |||||||||
| Long Term Growth Rate, % | 3.00 | |||||||||
| Free cash flow (T + 1) | 143 | |||||||||
| Terminal Value | 3,755 | |||||||||
| Present Terminal Value | 2,702 | |||||||||
| Enterprise Value | 3,088 | |||||||||
| Net Debt | 806 | |||||||||
| Equity Value | 2,282 | |||||||||
| Diluted Shares Outstanding, MM | 176 | |||||||||
| Equity Value Per Share | 1,293.34 |
What You Will Receive
- Genuine Johnson Matthey Data: Preloaded financial figures – including revenue and EBIT – derived from actual and projected data.
- Complete Customization: Modify essential parameters (yellow cells) such as WACC, growth %, and tax rates.
- Real-Time Valuation Updates: Automatic recalculations to evaluate the impact of changes on Johnson Matthey's fair value.
- Flexible Excel Template: Designed for quick adjustments, scenario analysis, and comprehensive projections.
- Efficient and Precise: Bypass the need to create models from scratch while ensuring accuracy and adaptability.
Key Features
- Comprehensive DCF Calculator: Offers detailed unlevered and levered DCF valuation models tailored for Johnson Matthey Plc (JMATL).
- WACC Calculator: Features a pre-built Weighted Average Cost of Capital sheet with adjustable inputs.
- Customizable Forecast Assumptions: Easily update growth rates, capital expenditures, and discount rates.
- Integrated Financial Ratios: Evaluate profitability, leverage, and efficiency ratios specific to Johnson Matthey Plc (JMATL).
- Interactive Dashboard and Charts: Visual representations summarize essential valuation metrics for straightforward analysis.
How It Works
- 1. Access the Template: Download and open the Excel file featuring Johnson Matthey Plc’s (JMATL) preloaded data.
- 2. Adjust Assumptions: Modify essential inputs such as growth rates, WACC, and capital expenditures.
- 3. View Immediate Results: The DCF model automatically computes the intrinsic value and NPV.
- 4. Explore Different Scenarios: Analyze various forecasts to evaluate different valuation outcomes.
- 5. Utilize with Assurance: Deliver professional valuation insights to inform your decision-making.
Why Choose This Calculator for Johnson Matthey Plc (JMATL)?
- Accurate Data: Utilize authentic Johnson Matthey financial data for dependable valuation outcomes.
- Customizable: Modify crucial factors such as growth rates, WACC, and tax rates to align with your forecasts.
- Time-Saving: Ready-to-use calculations mean you can skip the preliminary setup.
- Professional-Grade Tool: Tailored for investors, analysts, and consultants in the industry.
- User-Friendly: An intuitive design with clear step-by-step guidance for all users.
Who Can Benefit from This Product?
- Individual Investors: Make well-informed choices when buying or selling Johnson Matthey shares (JMATL).
- Financial Analysts: Enhance valuation workflows with comprehensive financial models at your fingertips.
- Consultants: Provide clients with expert valuation insights efficiently and accurately.
- Business Owners: Gain insights into the valuation of major companies like Johnson Matthey to shape your own business strategy.
- Finance Students: Acquire practical valuation skills by working with real-world data and case studies.
Contents of the Template
- Pre-Filled DCF Model: Johnson Matthey Plc’s (JMATL) financial data preloaded for immediate analysis.
- WACC Calculator: Comprehensive calculations for Weighted Average Cost of Capital.
- Financial Ratios: Assess Johnson Matthey Plc's (JMATL) profitability, leverage, and operational efficiency.
- Editable Inputs: Adjust assumptions such as growth rates, profit margins, and CAPEX to suit your analysis needs.
- Financial Statements: Annual and quarterly reports to facilitate in-depth evaluation.
- Interactive Dashboard: Effortlessly visualize essential valuation metrics and outcomes.
Disclaimer
All information, articles, and product details provided on this website are for general informational and educational purposes only. We do not claim any ownership over, nor do we intend to infringe upon, any trademarks, copyrights, logos, brand names, or other intellectual property mentioned or depicted on this site. Such intellectual property remains the property of its respective owners, and any references here are made solely for identification or informational purposes, without implying any affiliation, endorsement, or partnership.
We make no representations or warranties, express or implied, regarding the accuracy, completeness, or suitability of any content or products presented. Nothing on this website should be construed as legal, tax, investment, financial, medical, or other professional advice. In addition, no part of this site—including articles or product references—constitutes a solicitation, recommendation, endorsement, advertisement, or offer to buy or sell any securities, franchises, or other financial instruments, particularly in jurisdictions where such activity would be unlawful.
All content is of a general nature and may not address the specific circumstances of any individual or entity. It is not a substitute for professional advice or services. Any actions you take based on the information provided here are strictly at your own risk. You accept full responsibility for any decisions or outcomes arising from your use of this website and agree to release us from any liability in connection with your use of, or reliance upon, the content or products found herein.